Crystal Ball Example: Should we increase our Prices?
Note: this example is modeling an increase but the Crystal Ball can also be used to model a decrease.
Assumptions made in this example:
- In scenario 1, the price is increased with no other changes (same sales volume).
- In scenario 2, we are testing a loss of sales as a result of increasing the price and are assuming a retail or manufacturing business where Direct Costs are 100% variable (based on volume). If volume decreases by 5% so will Direct Cost Wages and Direct Costs Other (assuming this is mostly materials).
- In scenario 3, we are testing what the salespeople think would be the maximum loss of sales due to a price increase. We are also assuming a retail or manufacturing business where Direct Costs Wages and Direct Costs Other are 100% variable in line with volume.
- In scenario 4, we are assuming a service business where Direct Costs Wages would change in line with volume (variability 100%), but Direct Costs Other would not change (no materials), so 0% variability.
Which levers will be affected?
| Lever | Impact – Scenario 1 | Impact – Scenario 2 | Impact – Scenario 3 | Impact – Scenario 4 |
| Price | 4% | 4% | 4% | 4% |
| Volume | – | -5% | -15% | -5% |
| DC – Wages | – | Variability 100% | Variability 100% | Variability 100% |
| DC – Other | – | Variability 100% | Variability 100% | Variability 0% |
| IDC – Wages | – | Variability 0% | Variability 0% | Variability 0% |
| IDC – Other | – | Variability 0% | Variability 0% | Variability 0% |
| AR Days | – | – | – | – |
| Inventory Days | – | – | – | – |
| AP Days | – | – | – | – |
| Fixed Assets | – | – | – | – |
Scenario 1: A price increase of 4% with no reduction in sales (volume)
Enter 4 in the Change % on the Price lever.
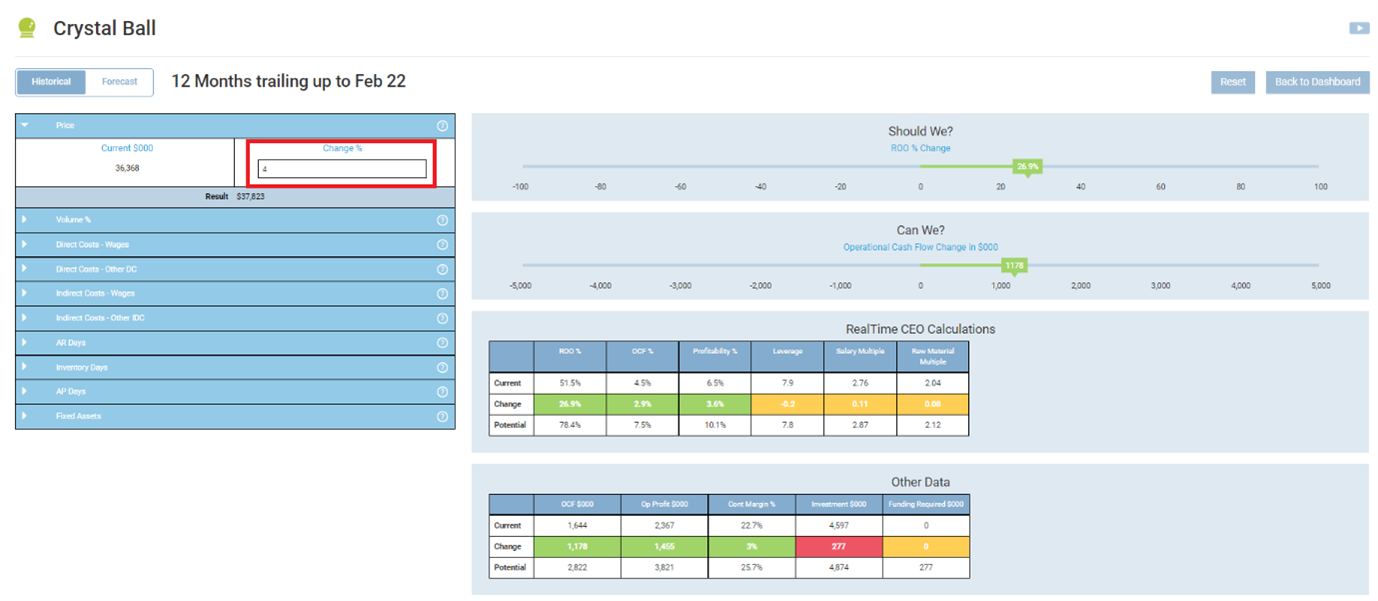
This is a Yes/Yes decision. It increases Return on Operations and Operational Cash Flow.
Scenario 2 – A potential loss of sales (volume) resulting from the increase in price – manufacturing or retail business
Enter -5 in the Change % on the Volume lever assuming we could lose 5% of sales, 100% in the Direct Costs Wages and Direct Costs Other variability, 0% in the Indirect Costs Wages and Indirect Costs Other variability.
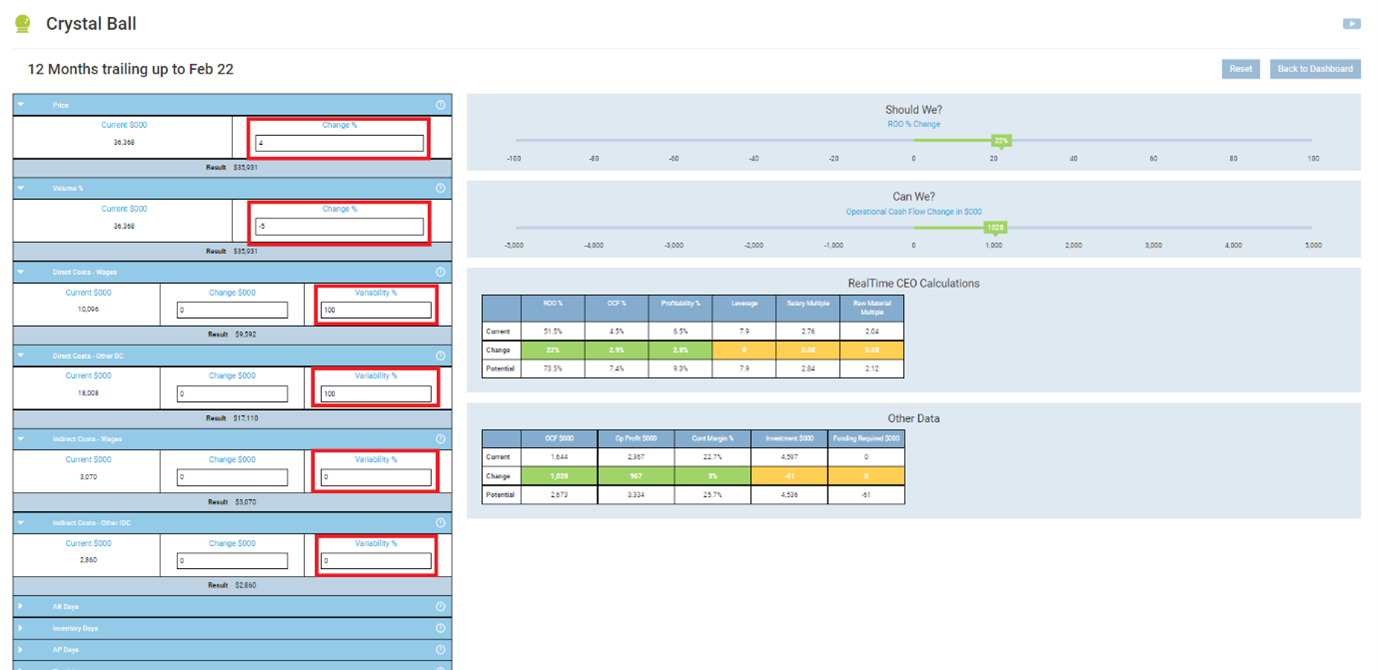
It is still a Yes/Yes decision. It increases Return on Operations and Operational Cash Flow even if we lose 5% of sales.
Scenario 3: What if we lost the maximum sales (worst case scenario) – manufacturing or retail business
Enter -15 in the Change % on the Volume lever assuming we could lose 15% of sales, 100% in the Direct Costs Wages and Direct Costs Other variability, 0% in the Indirect Costs Wages and Indirect Costs Other variability.
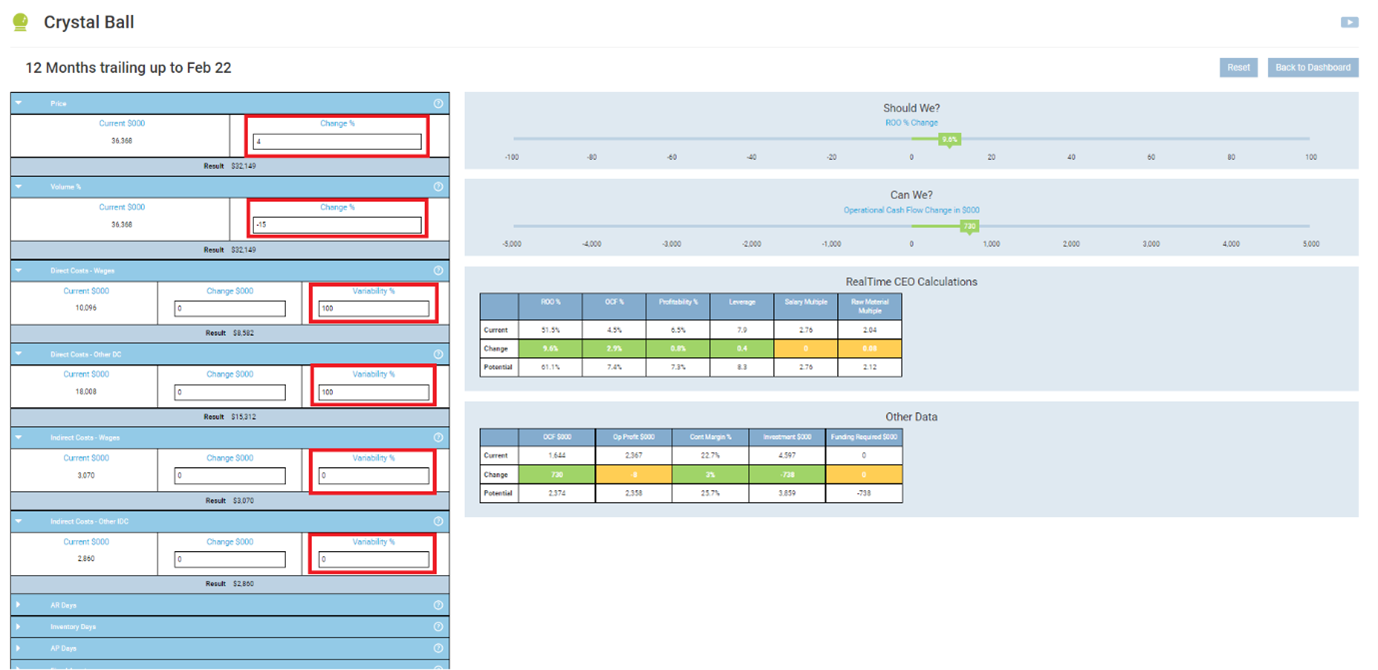
It is still a Yes/Yes decision. It increases Return on Operations and Operational Cash Flow even if we lose the maximum 15% of sales (the salespeople say this is the worst-case scenario).
Scenario 4: A potential loss of sales (volume) resulting from the increase in price – service business
Enter -5 in the Change % on the Volume lever assuming we could lose 5% of sales, 100% in the Direct Costs Wages variability, 0% Direct Costs Other variability, 0% in the Indirect Costs Wages and Indirect Costs Other variability.

It is a Yes/Yes decision. It increases Return on Operations and Operational Cash Flow.
You can also stress test the decision. Enter different volume losses to see the point where it is no longer a Yes/Yes decision.
What if the business does not have an ‘across the board’ price increase?
To test the decision of increasing the price for one revenue source, calculate that revenue source’s percentage of the total revenue and enter a weighted percentage in the price change. E.g. the revenue source to be increased makes up 60% of the total revenue, therefore 60% of 4% increase is 2.4%, so enter that rather than 4%.
Company
Contact Us
© 2024. RealTime CEO. All Rights Reserved