RealTime CEO Blog > ROO – Return on Operations 

‘COVID-Zero’: Can We Afford It?
‘COVID-Zero’: Can We Afford It?
By A. F. Cannon,
Writing for RealTimeCEO
The Australian government’s lockdowns and COVID-Zero policies have saved many lives, yet they cost our economy tens of millions of dollars a day. With all the uncertainties surrounding the pandemic’s future, can our current approach continue? This article looks at the health and economic implications of Australia’s policies.
I. The Cost of COVID-Zero
It is late August 2021 and over half of all Australians have been forced into lockdown.[1] After nearly a year and a half of the COVID pandemic, most citizens of NSW, Victoria and the ACT are once again confined to their houses; other states are prepared to enter snap lockdowns if a single new COVID-19 case emerges. In the worst afflicted of all states, NSW Premier Gladys Berejiklian said her fight against the ‘diabolical’ COVID Delta variant is ‘literally a war.’[2] Days later she imposed a curfew upon people in her state’s worst afflicted areas.[3]
The new round of lockdowns is a result of what some have called Australia ‘COVID-Zero’ policy.[4] Since July 24th last year, Australia has pursued an aggressive suppression[5] strategy to control the COVID-19 outbreak. An alternative to absolute elimination, controlled transmission and ‘do nothing’ approaches,[6] we use hard, early lockdowns to suppress the virus’s spread. It aims to stop community transmission and involves significant restrictions on international travel, social gathering, dining out. It also includes mandates for social distancing and mask-use.
Whatever the health benefits of the lockdowns, the COVID-Zero policy comes with obvious and significant economic costs: lockdowns make lots of business activities impossible. Economists estimate our COVID-Zero lockdowns cost the local economies in Brisbane and Melbourne around $100 million a day; in Sydney, they cost over $140 million. By constraining our commercial activities, this year’s winter lockdowns alone may have reduced Australia’s GDP by $17bn between June and August.[7]
Luckily the federal government has supported those affected by the policies. But as of May 2021, the federal government had spent $291 billion on pandemic-related economic support, a number that will increase with every day our country remains in lockdown.
These are enormous sums, so our COVID-Zero policies raise an obvious question for us: can we afford to keep locking down our economy?
Businesses and working people have suffered immense damage during the pandemic so far. Our COVID-Zero policies severely constrain the hours worked in our economy. After falling dramatically during the early days of the quarantines, quarterly hours worked—a statistic that tells us how much work employed people do in our country every three months—only just returned to its pre-pandemic level in June 2021. With the new lockdowns, we ought to expect them to fall once again.
Furthermore the cost of the lockdowns isn’t distributed evenly through the economy. Low-income service, tourist and retails workers see the greatest risk to their livelihoods during lockdowns,[8] while younger people with more years left to live will bear most of the consequences of policies that protect the elderly more than anyone else. The fall in employment is also concentrated in the private sector. Between June 2019 and June 2020, the private sector shed 541,700 of its roughly 11,000,000 employees while the public sector lost only 5,500 of its 2,000,000 workers. This decline brought the share of total employment made up by public sector workers in Australia from 15.9% to 16.6%; at the same time, the public sector wage bill rose by 4% while the average wage grew by just 1.4%.[9]
This inequality extends to businesses too. Some economists fear the lockdowns will transform the economy’s structure, shifting us away from small businesses and towards international conglomerates. [10] The rationale for their anxiety is sound: during lockdown, consumption declines, small business retail sales plummet and people shift towards online shopping with large businesses like Amazon.[11] Data on the number of Australia small is only available up to the 2018-19 financial year, but it is likely that the COVID lockdowns will exacerbate a trend observable since 2014-15: the share of people working for big business will increase at the expense of the share employed by small businesses.[12] Complicating this however are some surprising stats: after a predictably bad year in 2019-20, the net increase in the number of businesses was 45% higher in 2020-21 than in 2018-19.[13] Many of these will be small businesses so we must wait to see how this surge in business creation affects the economy.
Beyond economics, the lockdowns have also had significant health effects of their own; the cost to our brains is particularly shocking. Recent research suggests that lockdowns have starved American children of social interaction, leading to a fall in average IQ of 22 points of those born during the pandemic.[14] Neuroscientists also worry about the effects of boredom, isolation, stress and inactivity upon adults, many of whom report experiences of cognitive decline and memory loss during lockdowns.[15] And a paper by the USA’s National Bureau of Economic Research also suggests the unemployment shock caused by the COVID lockdowns has likely increased mortality rates and reduced life expectancy.[16] The NBER researchers forecast nearly a million extra deaths in the US over the next 15 years from lockdown’s unemployment effects alone.
Scientists have also recorded a surge in cases of depression and related mental health problems: partly owing to the lockdowns, a psychological ‘shadow-pandemic’ has accompanied the virus’s spread as people worldwide.[17] In the USA, the share of people experiencing anxiety and depression was at 41% in January 2021, a nearly fourfold increase from the same month in 2019.[18] On a more personal level, a British friend told me the UK lockdowns robbed her of a year of her life. Her mournful sentiments reflect those of others I know, who must now find a way to understand and replace the futures they have lost because of our policy choices.
We should be worried about these health concerns, not least because they carry significant economic costs of their own. Yet we mustn’t discount COVID-Zero’s social and economic benefits. Research from the Lowy Institute places us in the top 10 countries worldwide for our medical response to COVID. It’s easy to see why they did so:[19] relative to other countries Australia has an incredibly low COVID per capita death count – 38.38 deaths per million people. Currently we have had less than 1,000 COVID deaths: had we experienced the UK death rate of 1960.89 per million, 49,000 Australians would have died of COVID. Our excess mortality rate has also been lower than the UK and the US for almost the entire pandemic.[20] Though the government’s lockdown policy has significantly constrained our liberty, so far they have protected Australians against the worst human costs of the pandemic. For that we should be grateful.
Humanistic benefits aside, University of Melbourne research also shows that ‘very hard, very early’ lockdowns may be better for health, life and the economy in the long run.[21] Hard and early lockdowns cause severe economic harm in the short run. Yet they eventually lead to fewer days spent in lockdown and a lower death count, giving countries an overall economic benefit.[22] Plenty of other research reports similar findings: a professor at the Australian National University has argued that stronger COVID suppression policies lead to fewer deaths and less damage to GDP per capita. The argument that we can choose to contain COVID or save the economy, he says, is a false dichotomy.[23] Australia’s Treasury department seems to agree with the university researchers. They say the COVID-zero approach is ‘more cost effective than allowing higher levels of community transmission, which ultimately requires longer and more costly lockdowns.’[24]
IMF data further supports the idea that saving lives is compatible with protecting the economy. Australia had a lower per capita death rate and a smaller percent decline in GDP in 2020 than the UK, the US, Canada, France, Germany and Denmark. We even bested Sweden on both measures – a country that imposed no lockdowns whatsoever.[25]
Most importantly, if we add up the value of increased government spending, lost revenue, and the amount of equity, loans and guarantees provided in each country, Australia spent more in 2020 than only eight other developed countries analysed by the IMF.[26] Our approach has been cheaper and better than many others’.
While we should be cautious about offering conclusions before the pandemic is over, it seems that Australia has done relatively well so far. Of course, we shouldn’t take full credit for our success, nor should other countries like Sweden blame themselves entirely for their failures: in our globalised economies, our recovery depends largely on the actions and successes of our trading partners. Just like the recovery from 2008’s crash, China is partly responsible for our economic health. The value of our exports surged during the crisis, rising by about 33% between August 2020 and August 2021;[27] this was partly driven by the Chinese government’s construction-oriented economic stimulus that drove up the price of iron ore.[28] China’s policies have been good for Australia in some ways. Yet with Chinese demand falling, the price of iron crashing, and our continued lockdowns in the southeast, our economic success may dwindle over the coming months.
The political implications of our success are also serious. The Lowy Institute’s research mentioned before says authoritarian countries had the greatest success in handling the pandemic. Australia is supposed to be a liberal democracy, but our government undemocratically suspended our freedom for months in the pandemic. While Sweden’s liberal approach has ultimately left them in a far worse position than us,[29] our federal and state governments were highly authoritarian during the pandemic; the latest symptom of this is the police suppression of lockdown protests.[30] Without consulting the population, they decided at the pandemic’s start that survival was more important than freedom, even if it came at a great personal cost. They said life trumped liberty. I’ll let the reader think about what this means.
Political concerns aside, if our goal is to save lives while protecting our economy, the story of 2020 seems pretty unequivocal: COVID-Zero was not only better for our health; it was also better for business.
II. The Future of COVID-Zero (or, What Happened to ‘Flattening the Curve’?)
Australia has fared better than other countries both medically and economically. Fewer lives have been lost to COVID, our government has spent less and our GDP is in better shape. It seems that our COVID-Zero policy is responsible for our success.
But some questions remain: when and why did we decide to aim for ‘no community transmission’? Weren’t we supposed to ‘flatten the curve’ and go into lockdown for only a few months?
Those unaffected by lockdown-induced memory loss might recall that COVID-Zero was not our nation’s original strategy. In March 2020, we rejected both New Zealand’s ‘eradication’ approach and Sweden’s decision to let the virus run free. Instead our government first tried to contain and control the virus’s spread: they chose to ‘flatten the curve’, prolonging the pandemic while making it less severe.
On April 17th last year the Australian Health Protection Principal Committee (AHPPC) explained the strategy’s purpose. Flattening the curve means reducing the ‘rate of epidemic growth’ to a manageable level. To do so, the government would use temporary lockdowns, masks, and social distancing to make sure the medical sector wasn’t overwhelmed and give them time to build their capacity to treat the seriously unwell.
In the pandemic’s early stage, there was widespread support for ‘flattening the curve.’ People often compared it positively against New Zealand’s hard ‘eradication’ approach.[31] You might even recall Scott Morrison telling us to ‘flatten the curve’ throughout April, then triumphantly claiming that ‘we have flattened the curve’ in May.[32]
For a couple of months, Australia flattened its curve: we saw a constant and small trickle of new cases. Yet soon after Morrison spoke, Melbourne entered its second lockdown, and our national strategy quietly changed. On July 24th, Scott Morrison and the AHPPC introduced the COVID-Zero approach in two separate press releases, where they said that our goal was no longer to flatten the curve but to ensure there was ‘no community transmission’ of the virus.
Public health specialists have the eradication approach over ‘flattening the curve’ since the pandemic’s start;[33] some have even endorsed it. Yet when we changed our policy, neither Morrison nor the AHPPC explained why the shift was necessary.[34] The AHPPC even doctored history a little in their release, saying that ‘no community transmission’ was their goal ‘from the start of the pandemic,’ even though their first public use of that phrase in the context of COVID strategy occurred on July 24th.[35] As they stated on March 17th, their strategy beforehand was to keep the epidemic growth rate below one:[36] only in a pedantic sense is this the same goal as zero transmission.
The lack of explanation for the change to COVID-Zero is disturbing, even if later evidence largely vindicates the government’s choice. But whether COVID-Zero was the better policy, recent developments have opened a new pathway for us.
The COVID-Zero policy successfully minimised community transmission for about nine months. Between September 2020 and June 2021, daily new case counts remained in the low-double digits. Yet with the latest outbreaks in the southeast states, Australia is now on track to break 1000 cases a day. With this soaring case count, it would be incredibly difficult—and not to mention costly—to return to a point where we record only a few new cases a day. Morrison himself has said it’s ‘highly unlikely’ we would do so.[37] The days of COVID-Zero may now be a thing of the past.
Yet there is a new alternative: Australia will soon have enough vaccines to inoculate the population against COVID-19. Relying on modelling from the Doherty Institute,[38] Morrison now says lockdowns ‘won’t be necessary for much longer.’ Once they vaccinate 80% of the population, the government will impose only ‘highly targeted’ restrictions on the Australian people.[39] At the moment, it isn’t exactly clear when exactly when we will reach the required vaccination level.[40] There are even murmurings among the state governments about whether they will refrain from lockdowns once we achieve this target;[41] Berejikilian recently said some restrictions will remain in place even after NSW reaches the 80% vaccination target.[42] But now safe and effective vaccines are available, it seems like the end of the lockdowns is in sight. For once we are vaccinated and hospitalisation rates have fallen, the public health justification for lockdowns will be no more.
Despite this glimmer of hope, it isn’t clear that Morrison will be able to uphold his promise. Things remain highly uncertain. Currently, scientists worry about the emergence of a vaccine-resistant variant of COVID-19, and the Pfizer CEO has said one is likely to emerge eventually.[43] The Delta strain of COVID is already more resistant to vaccines compared to the original and Alpha variants.[44] Recent research also says that Delta’s viral load is up to 300 times greater than the original strain, while vaccinated people can carry a similar viral load to the unvaccinated.[45] Vaccines, it seems, do not stop the spread of Delta; instead, they reduce its harm to individuals. More worryingly, the newer Lambda variant—one of at least five other COVID strains you may not know about—might be even more vaccine-resistant.[46] The Lambda variant has followed the Delta variant to Australia, and it may only be a matter of time until the virus overwhelms us again and the government starts imposing lockdowns once more.
In the first year of the pandemic, it seems that COVID-Zero was the right policy. But if the pandemic continues and lockdowns remain necessary even after we are vaccinated, can we afford to return to COVID-Zero? The policy is enormously expensive and people are tired of the interruptions to their lives. Despite this, the short-run evidence suggests we really can’t afford to do anything else: as we saw COVID-Zero leads to better outcomes for our health and economy.
Yet the question is far more complicated than most of our politicians and scientists are prepared to admit, for we ultimately have no idea what our political decisions today will bring in the long term. The virus inflicts death and suffering and while the lockdowns mitigate its mindless violence, they cause losses of their own. Both are a source of grief and as Ellen Cushing wrote in The Atlantic, ‘we simply don’t know the long-term effects of collective, sustained grief.’[47] The long-term economic, political and psychological effects of the COVID-19 crisis and our response to it are unknowable today. The passage of history and grief and loss is completely unpredictable. The best we can do is to act with moderation and caution while constantly re-evaluating our approach. It seems like we have moved in the right direction so far, and in the absence of other ideas, arguably we should continue. But only time will reveal whether our COVID-Zero policies were worth it. Let’s hope they are.
REFERENCES
[1] See https://www.bbc.com/news/world-australia-58277503
[2] See https://www.aljazeera.com/news/2021/8/14/lockdown-fines-raised-as-australia-faces-worst-covid-situation and https://www.stuff.co.nz/world/australia/126071729/covid19-in-australia-415-new-cases-as-diabolical-delta-strain-continues-to-spread-in-nsw
[3] See https://www.theguardian.com/australia-news/2021/aug/23/nsw-covid-19-lockdown-restrictions-sydney-suburbs-regional-new-south-wales-lgas-act-canberra-update-coronavirus-face-mask-rules-explained-5km-radius-travel-masks
[4] See https://www.bloomberg.com/news/newsletters/2021-07-21/australia-s-covid-zero-strategy-hits-a-wall and https://edition.cnn.com/2021/08/22/australia/australia-morrison-zero-covid-19-borders-intl-hnk/index.html
[5] See https://www.health.gov.au/news/eliminating-covid-19-a-false-hope
[6] See https://www.pm.gov.au/media/update-coronavirus-measures-160420
[7] See https://www.smh.com.au/politics/federal/cost-of-lockdowns-is-17-billion-and-counting-20210812-p58i58.html and https://theconversation.com/yes-lockdowns-are-costly-but-the-alternatives-are-worse-163572 and https://www.couriermail.com.au/business/qld-business/bloody-furious-lockdown-anger-as-economy-takes-700m-hit/news-story/96532c6a20084944621f73e3852616da and https://www.brisbanetimes.com.au/national/queensland/off-a-cliff-qld-businesses-pay-multimillion-dollar-toll-for-lockdown-20210630-p585la.html and https://www.smh.com.au/politics/federal/capital-lockdowns-to-deliver-2-5b-hit-as-business-takes-another-blow-20210629-p5859c.html
[8] See https://www.frontiersin.org/articles/10.3389/fpubh.2020.00241/full
[9] See https://www.abs.gov.au/media-centre/media-releases/annual-wage-growth-remains-14 and https://www.abs.gov.au/statistics/labour/employment-and-unemployment/labour-force-australia/jun-2020 and https://www.abs.gov.au/statistics/labour/employment-and-unemployment/employment-and-earnings-public-sector-australia/latest-release and https://www.abs.gov.au/statistics/labour/employment-and-unemployment/labour-force-australia/jun-2020
[10] See https://www.washingtonpost.com/outlook/2020/07/09/after-covid-19-giant-corporations-chains-may-be-only-ones-left/
[11] See https://www.smartcompany.com.au/finance/economy/lockdowns-small-business-owners-pandemic-jason-murphy/
[12] See p.10 of https://www.asbfeo.gov.au/sites/default/files/ASBFEO%20Small%20Business%20Counts%20Dec%202020%20v2.pdf
[13] See https://www.abs.gov.au/statistics/economy/business-indicators/counts-australian-businesses-including-entries-and-exits/latest-release
[14] See https://www.theguardian.com/world/2021/aug/12/children-born-during-pandemic-have-lower-iqs-us-study-finds
[15] See https://www.theatlantic.com/health/archive/2021/03/what-pandemic-doing-our-brains/618221/ and https://www.theguardian.com/us-news/2021/jun/24/pandemic-brain-covid-coronavirus-fog-concentrate
[16] See https://www.nber.org/system/files/working_papers/w28304/w28304.pdf
[17] See https://www.newstatesman.com/politics/health/2021/03/mourning-and-melancholia-psychological-shadow-pandemic and https://www.nature.com/articles/d41586-021-00175-z
[18] See https://www.kff.org/coronavirus-covid-19/issue-brief/the-implications-of-covid-19-for-mental-health-and-substance-use/
[19] See https://interactives.lowyinstitute.org/features/covid-performance/#politics
[20] See https://ourworldindata.org/excess-mortality-covid
[21] See https://pursuit.unimelb.edu.au/articles/we-need-to-talk-about-elimination-vs-suppression-in-australia-again
[22] See https://www.intereconomics.eu/contents/year/2021/number/1/article/covid-19-lockdowns-fatality-rates-and-gdp-growth.html
[23] See https://theconversation.com/data-from-45-countries-show-containing-covid-vs-saving-the-economy-is-a-false-dichotomy-150533
[24] See https://treasury.gov.au/sites/default/files/2021-08/PDF_Economic_Impacts_COVID-19_Response_196731.pdf
[25] See https://www.statista.com/statistics/1104709/coronavirus-deaths-worldwide-per-million-inhabitants/ and https://www.imf.org/external/datamapper/NGDP_RPCH@WEO/OEMDC/ADVEC/WEOWORLD
[26] See https://www.imf.org/en/Topics/imf-and-covid19/Fiscal-Policies-Database-in-Response-to-COVID-19
[27] See https://tradingeconomics.com/australia/exports
[28] See https://www.abc.net.au/news/2021-08-23/iron-ore-crash-economy-dollar-analysis/100396988
[29] See https://www.businessinsider.com.au/sweden-covid-no-lockdown-strategy-failed-higher-death-rate-2021-8
[30] See https://www.theguardian.com/australia-news/2021/aug/21/australia-anti-lockdown-rallies-protesters-violently-clash-with-police-in-melbourne
[31] See https://www.abc.net.au/news/2020-03-27/coronavirus-options-to-end-lockdown-explained/12090270
[32] See https://www.abc.net.au/news/2021-01-23/how-scott-morrison-language-changed-coronavirus-pandemic-year-on/13075506
[33] See https://pursuit.unimelb.edu.au/articles/the-maths-and-ethics-of-minimising-covid-19-deaths and https://www.abc.net.au/news/2020-03-27/coronavirus-options-to-end-lockdown-explained/12090270
[34] See https://www.health.gov.au/news/australian-health-protection-principal-committee-ahppc-statement-on-strategic-direction and https://www.pm.gov.au/media/national-cabinet-24jul20
[35] See https://bit.ly/3BcovQJ
[36] See https://www.health.gov.au/news/australian-health-protection-principal-committee-ahppc-coronavirus-covid-19-statement-on-17-march-2020-0
[37] See https://www.perthnow.com.au/news/coronavirus/scott-morrison-says-australia-highly-unlikely-to-reach-covid-zero-again-ng-b881977188z
[38] See https://www.doherty.edu.au/uploads/content_doc/DohertyModelling_NationalPlan_and_Addendum_20210810.pdf
[39] See https://www.news.com.au/national/politics/pm-scott-morrison-says-covid19-focus-needs-to-change-from-cases-to-hospitalisations/news-story/3dc575ff7774e5a3b33bc5def6a9191e
[40] See https://www.theguardian.com/australia-news/2021/jul/30/australians-will-be-able-to-freely-travel-overseas-when-80-of-the-population-is-vaccinated-morrison-says
[41] See https://www.theguardian.com/australia-news/2021/aug/20/scott-morrison-warns-leaders-not-to-break-covid-reopening-deal-ahead-of-national-cabinet-meeting
[42] See https://www.abc.net.au/news/2021-08-17/nsw-covid-19-restrictions-to-remain-after-vaccination-high/100381078
[43] See https://www.theguardian.com/world/2021/aug/15/new-covid-variants-will-set-us-back-a-year-experts-warn-uk-government and https://www.insider.com/pfizer-ceo-vaccine-resistant-coronavius-variant-likely-2021-8
[44] See https://www.nature.com/articles/d41586-021-01696-3
[45] See https://www.ndtv.com/world-news/delta-variant-cases-show-300-times-higher-viral-load-shows-south-korea-study-2517757 and https://www.theguardian.com/world/2021/aug/19/jabbed-adults-infected-with-delta-can-match-virus-levels-of-unvaccinated
[46] See https://www.who.int/en/activities/tracking-SARS-CoV-2-variants/ and https://www.infectioncontroltoday.com/view/lambda-variant-of-covid-19-might-be-resistant-to-vaccines and https://www.reuters.com/business/healthcare-pharmaceuticals/delta-infections-among-vaccinated-likely-contagious-lambda-variant-shows-vaccine-2021-08-02/ and https://theconversation.com/covid-lambda-variant-is-now-in-29-countries-but-what-evidence-do-we-have-that-its-more-dangerous-163936
Economics After COVID: Boom, Bust, or Something In-Between?
By Alasdair Cannon
Executive Summary
- In 2021, we hope that the end of the pandemic will come. But what will our post-pandemic economies look like? A few scenarios are possible.
- Boom: Some believe that savings accumulated during 2020’s lockdown will fuel a boom, as pent-up demand is unleashed on the economy.
- Bust: But there is also a chance of a debt-crisis once loan moratoriums end.
- Politics: Long-term recovery depends on our politics – we must change the policies that led to a low-growth, low-investment environment even before the pandemic.
- If business and government take the right actions now, there is reason to hope for a better future.
I. After the Pandemic…
In March 2021, the pandemic’s end seems tantalisingly close. An unprecedented vaccine was created with miraculous speed, and now governments worldwide are inoculating their populations against the COVID-19 virus. With continued fortune and perseverance, lockdowns and quarantines will soon be a thing of the past, along with their economically disastrous restrictions on human freedom.
This is good news. Nonetheless, it isn’t clear what kind of world we will return to once we can freely leave our homes again. Economists like Joseph Stiglitz fret over the ‘long-term scarring’ our economies have suffered during lockdown. His worries are justified: most signs point towards an almost inconceivable level of damage whose long-term effects are obscure. In 2020, the UK suffered its worst recession in over 300 years. The UK’s GDP fell by 9.9% last year, a fall whose magnitude is unmatched in any crisis since the Great Frost of 1709, a winter so cold that waterways and trade routes froze, and tree trunks shattered where they stood.[i] COVID-19 gave the world and the UK a dark winter, the true consequences of which won’t be understood for years to come.
Elsewhere, though, there are signs that an economic boom may occur once the virus is controlled. Some people argue that the savings accumulated during the pandemic could be converted into a rush of economic activity that will stimulate the economy back into prosperity. There is weight to this hypothesis: a large surge in consumer demand caused a ‘global supply chain crunch’[ii] in February this year, forcing Australian exporters to scramble for scarce shipping containers.
As the vaccine is administered, we hope for the recovery of our health and our economies. Despite our hopes, the future remains ambiguous. Recovery, depression, stagnation – we simply don’t know what we’ll face once we contain the virus. Of course, we cannot eliminate this ambiguity any more than we can see the future before it arrives. But we can try to understand it. Doing so is imperative if we want to coordinate our economic activities over the coming months and years. Thus, we must try to grasp the opportunities and threats that could arise in our post-COVID world while considering how these can be turned into long-term gains. Such is the only way towards a reasonable hope, after all.
II. Boom: Pent-Up Demand
Recently, commentators have proposed a scenario that could lead to a hopeful future after COVID-19: the release of consumers’ ‘pent-up demand’. The New York Times ran an article on February 21st that epitomised this notion, entitled ‘On the Post-Pandemic Horizon, Could That Be… a Boom?’[iii] There, the Times argued that an economic boom could occur when lockdown ends, as people spend the ‘trillion-dollar mound of cash’ accumulated during quarantine as a ‘result of lockdown-induced saving and successive rounds of stimulus payments’. They hope that money unspent last year will be spent this year, that 2020’s ‘pent-up demand’ will be unleashed in 2021, causing a ‘supercharged’ economic recovery and ‘years of stronger growth’.
Not often discussed, ‘pent-up’ demand is a simple and intuitive concept. During a lockdown, people are unable to spend their money in the ways they ordinarily would. They are also deprived of outlets for their usual consumer desires. Unable to travel, eat at restaurants, or visit cinemas, people who keep their jobs save money at an above-normal rate, while their desire for various goods and services becomes ‘pent up’.
A lockdown thereby creates a unique situation: repressed consumer wishes are combined with an abundance of cash. So, when the lockdown is lifted and people embrace their restored freedom, they rush back into the economy, spending their excess savings on the pleasures they missed. The demand ‘pent-up’ during lockdown is thus unleashed on the economy. Consumption spending, business activity and economic growth suddenly increase.
There are historical precedents for this kind of consumer behaviour. NPR’s Planet Money recently described how attendance at American baseball games plummeted in 1918, as the Spanish Flu broke out towards the end of WWI. When the war ended, and the pandemic had mostly cleared, attendance skyrocketed. 6,532,439 people went to a baseball game in 1919, more than double the number for 1918.[iv] This dynamic from the end of the 1910s is exactly what people forecast for the end of the COVID-19 pandemic, where US savings rates reached an all-time high of almost 26%.[v]
As the shortage of shipping containers mentioned before shows, pent-up demand is being released right now. While shortages are undesirable and can cause price inflation, we can rightly read this as a sign of recovery. Though it is too early to determine its extent, a revival of economic activity is underway as consumers spend their accumulated savings.
With pent-up demand, new opportunities for prosperity are therefore emerging right now. This is a cause for optimism: however, we must temper our fledgling hope with a few caveats.
First, we can’t expect that all of 2020’s deferred demand will become spending in 2021. In all likelihood, some fraction of 2020’s demand has been irrevocably lost. Time has passed and wants have waned. Compounding this is the natural hesitation that descends on an economy after a crisis. There are so many uncertainties at the moment – How effective are the vaccines? Will the virus mutate? Will we return to lockdown? Is another crisis coming? – that people will probably save this money to insure against future adversities.
Beyond this, we must remember that the direct gains from pent-up demand may only be temporary. At most, people will be able to spend a small portion of a year’s income in their post-lockdown rush. There is also no reason that the release of pent-up demand will cause a permanent increase in rates of consumption spending. If anything, people are likely to remain more conservative than before due to the prevailing economic uncertainty and will reduce their spending once their pent-up demand is exhausted.
Allowing the gains from pent-up demand to vanish in this way would be a waste. But if we want the gains to be permanent, pent-up demand must be directed towards the right ends. Funnelled towards industries and projects where profitable, long-term investment opportunities exist, the eruption of post-pandemic demand will support these investments and the jobs they create.
Pent-up demand is not a panacea for the COVID crisis, but it is an opportunity. Used properly, it could be a platform for long-term prosperity, growth and recovery. Spent on short-term opportunities, the macroeconomic improvements will be similarly short-lived. Policymakers and business leaders should act appropriately to ensure a slow-burn over a flash in the pan, as only the former will restore us to prosperity.
III Bust: Debt Crisis?
Against the opportunities implied by pent-up demand is the looming threat of a debt crisis.
In a remarkable moment in the pandemic’s early days, governments worldwide declared moratoriums and forbearances on debt repayments. Australians and Americans, among others, were relieved of their obligations to various debts, like mortgages and student loans, while landlords were banned from evicting their tenants in both countries. Of course, this protected the vulnerable from the ravages of a conjoined health and economic crisis. But these measures also contributed to the high saving rates observed during lockdown, and allowed income to be repurposed for consumption spending, helping stimulate the economy.
The moratoriums were an admirable and necessary action. However, they were always destined to be temporary. In Australia, many of these protections have already ended. Moratoriums on evictions remain only in South Australia and Victoria but will conclude in March 2021,[vi] and debt repayment provisions expired last year. And Americans will gradually lose their protections between March and September 2021.[vii]
Soon, banks will demand payments from their customers once more. Depending on the state of the economy – especially whether the indebted have returned to work and/or have enough savings to cover their loan commitments – this demand could quickly become catastrophic. If people in indebted households are still unable to work, restarting debt obligations will strain their savings. Aside from dampening their ability to stimulate the economy and unleash their pent-up demand, it could force them into insolvency and vagrancy. If enough people are pushed to this extreme, aggregate demand will fall while banks will be hit with large losses. End the moratoriums too soon, then, and we could provoke a debt crisis and an economic recession at once.
It is impossible to say whether a catastrophe like this will occur in 2021. However, the data suggest a growing vulnerability. In the USA, mortgage delinquency rates across all loan types increased substantially through 2020.[viii] Meanwhile, total US household debt reached an all-time high of $14.6tn by the end of last year.[ix] In Australia, the household debt-to-income ratio remains historically high.[x] And in both countries, the unemployment and underemployment rates are still elevated. While these variables aren’t conclusive, the government must be careful when revoking these measures. We do not need to add a financial crisis to our existing problems.
IV The Long-Term: An Opportunity to Improve?
Pent-up demand and the possible debt crisis are short-term issues: they will probably come to a head within the next year or two. Of equal or greater importance, however, are the longer-term systemic issues that the COVID crisis has brought to light. Like those already discussed, these also present causes for optimism and caution.
Nobody would deny that COVID-19 has brought destruction to economies around the world. Our human capital stock has been damaged through death and educational disruption, and the long-term effects of this will be significant. Nonetheless, like a cleansing fire, COVID-19 has also cleared the way for growth and improvements in our economies. Many businesses have closed, but we have gained the space to create new and better businesses in their place. And when we started working from home during lockdown, we improved workplace communications technology and discarded inefficient and outmoded norms about our workplaces. The need to commute to work has been eliminated for people worldwide, reducing noise, traffic, and pollution in our cities, while freeing up more time for productive work and leisure for workers. Make no mistake: this is a significant economic transformation that will reshape our societies for years to come.
The COVID-19 crisis also presents an impetus and opportunity for reforming our wider economic paradigm. Advanced economies around the world were not thriving before COVID arrived. As the World Bank reports, the ‘global economy headed into the COVID-19 pandemic on the heels of a decade of slowing productivity growth and weak investment.’ Their research found that by 2018, labour productivity growth in advanced economies had slowed to 0.8% from 1.0% between 2000-09. And in 2019, investment growth had fallen below its 2000-09 average in two-thirds of the world’s economies.[xi] The situation in the USA is particularly unimpressive. Despite talks of a ‘strong economy’ in recent years, the best year for capital investment after the GFC was worse than all but four years between 1970 and 2008 (See Chart 1).
Around the world, there is a problem with investment. Yet it was not caused by an insufficient level of savings or liquidity but an unwillingness to invest. Before COVID-19, confidence in real economic investment had evaporated. This should be no surprise, for the COVID crisis is our third major economic downturn since the year 2000. It was also a threat that was predictable and possibly preventable but which nonetheless caught our governments off-guard, causing dramatic variations in responses from country to country. Business investment cannot thrive where instability prevails. Capitalism has decelerated and stagnated in recent years because our economic systems have become startlingly fragile and vulnerable.
Crucially, the repeated collapses and overall economic slowdown are not anomalies: they are signs of structural weaknesses. The neoliberal reliance on deregulated markets and our successive rounds of financial market support through bailouts and quantitative easing has led to a toxic situation: repeated crises have destroyed business confidence and forced interest rates to their all-time low, while financial markets have boomed due to government interventions. Thus, it has become rational for people to substitute away from real economic investment towards investment in shares: the returns to shares are larger and more secure.
The consequence of this, however, is an acceleration of share market growth coupled with a slowdown in real economic growth, which worsens with every new crisis, bailout and rate cut. This situation prevails in the US today. Between 2010 and 2020, nominal US GDP increased by roughly 40%,[xii] while the S&P500 index increased by nearly 200%. Stocks or the real economy: as an investor, where would you have put your money? Between the GFC and the COVID-19 crisis, the rational investor would have chosen stocks.
If we want our societies to recover and thrive after the COVID crisis – that is, if we want to rebuild our economies so they have higher GDP growth, more jobs, and better wages – we must commit to a course of action that supports real business investment and aggregate demand. We must use this as an opportunity to improve. Thus, we should support business investment in profitable projects that grow the real economy. These will create jobs, further supporting incomes, aggregate demand and continued investment in the future. Incentives for people to shift money from financial markets into the real economy are also necessary. At present, too much capital is tied up in non-productive investment: if we want a strong recovery, this money must enter the real economy. Likewise, if we support aggregate demand, businesses are more likely to invest because they can rationally expect greater profitability. To this end, policies to ensure that recovery is spread across high-income and low-income households are necessary, as are policies that encourage spending and stimulus throughout the economy.
Chart 1: USA Capital Investment as % of GDP, 1970 – 2019.
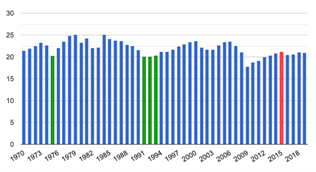
Source: https://www.theglobaleconomy.com/usa/capital_investment/
V On The Brink of the Future
Today, as always, we stand on the brink of the future. But our view is not clear. In the post-COVID world, the chance for prosperity mingles with the threat of new disasters. Tomorrow, we could have a vital and booming economy, or we could face stagnation or deep depression.
What happens next depends on our political and economic decisions. But it will also be shaped our attitudes toward the future. If we want our economic possibilities to be more hopeful, a collective optimism must prevail between businesses, individuals and governments today. The investments and actions needed for long-term prosperity will not otherwise occur. In pessimism, however, our future will necessarily become bleaker.
Against the catastrophe of 2020, a realistic and hopeful perspective is as necessary as pragmatic and efficient actions. At all levels, we must make efforts to foster a legitimate hope. Informed, optimistic beliefs will direct our actions towards the better future that we, those in the wake of disaster, so desperately crave. Our task, then, begins by understanding our situation, and all the risks and opportunities of our transformed world. It ends with effective, productive actions and a hopeful perspective: with views and decisions that reinforce one another for the better.
Endnotes
[i] See https://www.barrons.com/articles/u-k-is-headed-for-worst-recession-since-great-frost-of-1709-51588884310
[ii] See https://www.abc.net.au/news/rural/2021-02-01/food-shipping-container-shortage-puts-squeeze-on-trade/13100728
[iii] See https://www.nytimes.com/2021/02/21/business/economy/pandemic-economic-boom.html?action=click&module=Top%20Stories&pgtype=Homepage
[iv] See https://www.npr.org/sections/money/2021/01/12/955617983/what-1919-teaches-us-about-pent-up-demand
[v] See Joseph Stiglitz’s report, ‘The Economy of Tomorrow: Recovering and Restructuring After COVID-19’ at https://rooseveltinstitute.org/wp-content/uploads/2020/10/RI_-RecoveringandStructuringAfterCOVID19_IssueBrief_202010.pdf
[vi] See https://www.theguardian.com/australia-news/2020/nov/25/australias-rent-bomb-risk-means-countless-renters-could-face-eviction and https://ndh.org.au/debt-problems/housing/covid-19-changes-home-loans/
[vii] See https://www.cnbc.com/2021/01/20/biden-to-extend-the-national-ban-on-evictions-through-march-2021.html; https://www.whitehouse.gov/briefing-room/statements-releases/2021/02/16/fact-sheet-biden-administration-announces-extension-of-covid-19-forbearance-and-foreclosure-protections-for-homeowners/; and https://studentaid.gov/announcements-events/coronavirus
[viii] See https://www.newyorkfed.org/microeconomics/hhdc
[ix] See https://www.statista.com/chart/19955/household-debt-balance-in-the-united-states/
[x] See https://www.rba.gov.au/chart-pack/household-sector.html
[xi] See p.115 of their January 2021 ‘Global Economic Prospects’ report.
[xii] Real GDP increased by approximately 18% over the same period. Stats are sourced from the Bureau of Economic Analysis’ National Data. See https://apps.bea.gov/iTable/index_nipa.cfm
Voodoo Finance For Sick Markets: Stock Prices During COVID-19
By A. F. Cannon
Writing for Real Time CEO
Today, finance and economics have nothing to do with one another. I deliberately open with this ridiculous statement because financial markets in the last year have behaved in ridiculous ways. In 2020, the real economy in the USA shrank significantly; yet financial markets boomed. Some commentators have said that these trends defy logic and reality; others see how it mirrors the history of markets after the GFC. Either could be right; all we know, however, is that we need to understand it ASAP.
(I) Crash!
We’ll start with a brief history of our present situation – the COVID-19 lockdowns that have wrought economic havoc around the world.
In February, the World Health Organisation declared the COVID-19 outbreak a global pandemic, and economies around the world moved into an unprecedented lockdown. A massive shock rippled through the world’s markets as whole industries were pushed to the brink of ruin.
In response, respectable institutions began to issue dire GDP growth predictions. By March, Deutsche Bank said US GDP would fall by 12.9% in Q2 of 2020,[i] the largest quarterly fall since WWII. Goldman Sachs was even more pessimistic, predicting a contraction of 24% – an amount 2.5 times greater than anything in US history.[ii] Both were wrong. GDP instead contracted by 31.4% compared to Q1 2020 – a period where economic activity already fell 5% compared to Q4 of 2019.[iii]
Thus the US economy entered a dismal retraction, and financial markets responded accordingly. By mid-March, the S&P500 had fallen 30% from its historic highs, from 3379.45 pts on February 10th to 2237.40 pts on March 23rd. The signs were clear: 2020 was going to be a terrible year for investors.
But then, something remarkable happened. After the S&P500 hit its nadir in late March, it began a steep ascent, reclaiming 1000 points before June 30th. The New York securities industry doubled their usual first-half profits, taking home $27.6 billion before July.[iv] And on September 9th, the S&P500 reached its all-time high – 3580.84 pts. Investors rejoiced – somehow, despite the crisis, capital gains had increased.
Despite the dismal outlook, the S&P500 boomed in 2020. Share prices rocketed upwards, even while the real economy suffered incredible losses. So, I’ll reiterate: today, finance and economics have nothing to do with one another. Indeed, it seems like we’ve entered a system of what Joseph Stiglitz has called ‘ersatz capitalism’ – a land where share prices are divorced from real profits, and where markets behave like pale imitations of themselves.[v] Even our markets, it seems, have fallen victim to ‘post-truth’ politics.
(II) “It Makes No Sense”
Faced with these facts, a good friend of mine proclaimed that these movements contradict the logic that supposedly governs our economies. In his words: “It makes no sense.”
Like most others, he thought a) share prices should increase with demand, and b) demand for a firm’s shares goes up when we expect the firm to make more profit. He believed that prices are ‘rationally determined’ by a justified belief in future profitability.
To his credit, reality usually abides by this thinking: indeed, it is exactly why the stock market plummeted between February and March last year. People expected profits to fall, so prices declined.
But after the collapse in March, markets started contradicting these assumptions. Prices climbed even as the economy contracted. The demand for shares increased massively following the COVID-19 shock – even though the outlook for profitability and economic growth was dire.
If we believe share prices should depend on our expectations of profit, then we have to say: “It makes no sense.” And yet this our world today: we live in a time where economic reality no longer reflects the average person’s idea of economic theory.
(III) Making Sense, pt. I: Keynes
For this reason, we need a better theory. We must continue to make sense, even where reality starts to look unreal.
Luckily for us, a better theory already exists. All we need to do is abandon our idea that share prices are determined by considered, rational expectations of future profits. Instead – with thinkers like Keynes and Minsky – we must learn how irrationality rules markets, and how government intervention can distort prices.
To rehabilitate our ideas, we’ll turn first to one of the most important pieces of economic writing ever produced: Chapter 12 of Keynes’ General Theory of Employment, Interest & Money. In this short and brilliant essay from 1936, Keynes reveals the irrational behaviours that emerge when humans face an unknowable future. He has a particular interest in the unjustified conventions, beliefs and emotions we use to guide our decisions – that is, the human habits that make a mockery of our rationalistic pretensions.
Conventions
Keynes begins by discussing humanity’s tendency to rely on conventions for thinking when faced with uncertainty. As a trader himself, Keynes knew that humans have a habit of valuing stocks by assuming that the existing state of affairs will continue to prevail in the future.[vi] While this is irrational, the future is inherently uncertain; thus we have no alternative. Without a specific reason to do otherwise, we will usually believe that tomorrow will be like today.[vii]
Beliefs
Compounding this problem, Keynes also saw that accurate forecasts of profitability don’t fully determine share prices. Indeed, these forecasts are often irrelevant to investors, who spend their time trying to pre-empt what ‘average opinion expects the average opinion [of a stock’s value] to be’.[viii] The demand for shares changes based on fluctuations in investors’ beliefs about other investors’ beliefs. For an investor, it’s often more important to correctly guess the market’s belief about what will happen to a stock’s value than to accurately estimate future profitability – irrespective of whether those beliefs are informed or rational. Being right about profitability is not the same as actually making profits.
Emotions
Lastly, Keynes also saw how our investment decisions can be based on non-rational, emotional forces. He rightly states that our decisions affecting the future ‘cannot depend on strict mathematical expectation, since the basis for making such calculations does not exist’. That is, because we can’t see the future, we lack the ability to rationally calculate expected profits. Without the security of mathematics, we instead rely on ‘whim or sentiment or chance’ to make our choices. Thus, our markets are comprised of millions of people, buying and selling shares based on changes in their ‘spontaneous optimism’ rather than rational, knowledgeable calculation.[ix] Markets are driven by the heart – not the mind.
Implications
The truth about a firm’s future profitability can be irrelevant to share price. Our irrational taste for convention, belief and sentiment ensures that neither rationality nor logic determines share prices. Prices are irascible and maddening – much like the humans who try to control them. Accordingly, we must account for ‘the concealed factors of utter doubt, precariousness, hope and fear’ at play in our markets.[x] Failing to do so will leave us entirely blind about the truth of prices.
(IV) Making Sense, pt. II: Minsky
From Keynes, we learn that prices are not determined by rational laws, but by emotion and belief. Prices behave irrationally; rational expectations have never prevailed. We must accept this as the first truth of our markets; doing so will allow us to move towards an understanding of the erratic behaviour of markets in 2020.
However, Keynes’ thoughts don’t fully explain our situation, where share prices rose even though we knew profitability would fall. Our society seems to have gone beyond irrationality into a collective defiance of economic theory altogether. At this point, it looks like we are more anti-rational than irrational.
To understand our anti-rational markets, we must go beyond Keynes, and try to understand the role of government intervention. As we will see, the government has the power to sculpt the future by fixing expectations. They can move us from irrationality into anti-rationality because they can make us believe that shares will be profitable – even if we know this should be impossible.
The Financial Instability Hypothesis
Here, we turn to one of Keynes’ successors: Hyman Minsky. Like Keynes, Minsky was concerned with the surges and retreats of ‘spontaneous optimism’ that dominate the financial markets. But Minsky went a step further than Keynes: he saw how the mechanisms of the financial system could lead this optimism to snowball into ‘an explosive euphoria’.[xi] He saw how euphoria could cause the economy to collapse into a heap of insolvencies. And he saw how the government, faced with financial collapse, could permanently distort market outcomes.
His theory – the ‘financial instability hypothesis’ – is complex and elegant. To put it simply, it says that booming economic conditions lead banks to loan money in increasingly risky ways. Essentially, the banker’s confidence improves with the economy. As GDP grows, his faith in the ability to profit from his loans also increases. The banker takes greater risks, meaning that debt repayments become more precarious as the economy booms. So, when a shock inevitably hits, and people are unable to meet their debt obligations, widespread default occurs. The financial system is inundated by a wave of bankruptcies, threatening the survival of the entire system.[xii]
The unrealistic optimism of bankers has led to catastrophe – just like we saw in 2008’s GFC. But as society teeters over this economic abyss, the government then steps in. In the USA, Congress and the Federal Reserve now begin to enact policies that act as ‘circuit breakers’ against the recessionary forces: interest rate cuts, bailouts and quantitative easing (‘QE’). Following these circuit breakers are enacted, liquidity rises, banks avoid insolvency, and hopefully, bankers start lending once again. If so, investment increases, share prices rise, banking profits increase, recession is averted, and economic order is restored. At least, until another crisis hits, and the cycle repeats.
Moral Hazards
If the government is sensible, they then restrict the risky lending that caused the crisis. But if they aren’t, their decision to save the financial sector instead creates a ‘moral hazard’ – that is, they ensure that the parties who profit don’t bear the risks of banking.
Economists have long criticised governments for creating moral hazards after financial crises. Policies such as bailouts and QE teach bankers that risky lending merits no punishment. Indeed, as these policies tend to increase banking profits, they instead support and reward risky lending. So, if the government fails to tighten regulations after they prevent a crisis, their emergency support worsens the bankers’ risk-taking activities. Bankers will now have an implicit guarantee that they will be rescued if their lending causes another crisis in the future.
As ever, bankers remain unable to predict the future of financial markets. And for the most part, prices are still determined by irrational forces. However, by creating this moral hazard, governments can effectively give bankers a guarantee that the future will continue to be profitable – even in crises where real profitability is impossible.
(V) Quantitative Easing 2020
Government power can fix the future, leading to a world where standard economic thought looks like nonsense. Artificial moral hazards can severely distort price behaviour. Already an irrational process, price determination can become absurd where the government commits to saving bankers, no matter what.
We know this; it is no secret. However, moral hazards in financial markets are abundant today. Indeed, in the US, the moral hazard created by the government is so well known that it has an ironic nickname: the ‘Greenspan Put’.[xiii] In essence, the Greenspan Put is the Fed’s unbroken promise to save financial markets whenever a crisis hits, through measures like bailouts, QE and interest rate cuts.
In 2020, the Fed brought the Greenspan Put into play on March 16th, when they began a program of quantitative easing (QE) to support asset prices.[xiv] Between March 9th and June 8th, the Fed purchased toxic assets from banks in earnest, and their balance sheet increased by 69%. In absolute terms, $2.75 trillion of liquidity entered the financial system, an amount than that exceeds all the funds injected by the Fed’s QE program between 2008 and 2012. Banks then used this cash to buy assets from other banks.[xv] Demand for shares increased, and the value of the S&P500 rose 43% while the Fed conducted their short but enormous program of QE.[xvi]
As such, the value of shares did not rise because investors expected profitability to increase: investors expected the Fed to enact the Greenspan Put once again. In February, investors should have expected liquidity to rise dramatically in the coming months. They should have expected share prices to increase as a consequence, leading to capital gains.
So, when the Fed began QE in 2020, the demand for shares rose because a) the money supply increased, and b) because ‘average opinion’ expected ‘average opinion’ to expect prices to grow in the wake of this liquidity injection. Accordingly, investors bought shares and prices rose, confirming their belief.
(VI) Ersatz Capitalism
To sum up the preceding arguments, we will say the following. If we want our expectations of the future to be correct, we have two avenues at our disposal. We can become impossibly good at prediction. Or we can enlist the help of institutions powerful enough to guarantee our profits – no matter what happens.
From this perspective, the share market’s behaviour now makes sense. A belief in future profitability has not driven market returns this year. Instead, the provision of liquidity and the expectation of subsequent asset-price inflation has caused the rise of the S&P500 throughout 2020. It was not rationality or irrationality that increased capital gains; rather, it was government-induced anti-rationality, the moral hazard that has once again given us profits without profitability.
Across the world, there has been over $6 trillion in QE throughout 2020 – more than half of the total QE seen worldwide between 2009 and 2018.[xvii] Accordingly, we will probably see a repetition of the USA’s experience in many other countries. This includes Australia, where the Reserve Bank recently dropped interest rates to 0.1% and announced a $100 billion QE program.[xviii]
In the months to come, we should therefore prepare ourselves for life in this system of ‘ersatz capitalism’. We should expect financial markets to behave like pale imitations of themselves for some time. Forever, perhaps – unless our governments reform the financial sector in favour of stability instead of this strange mode of capitalism.[xix]
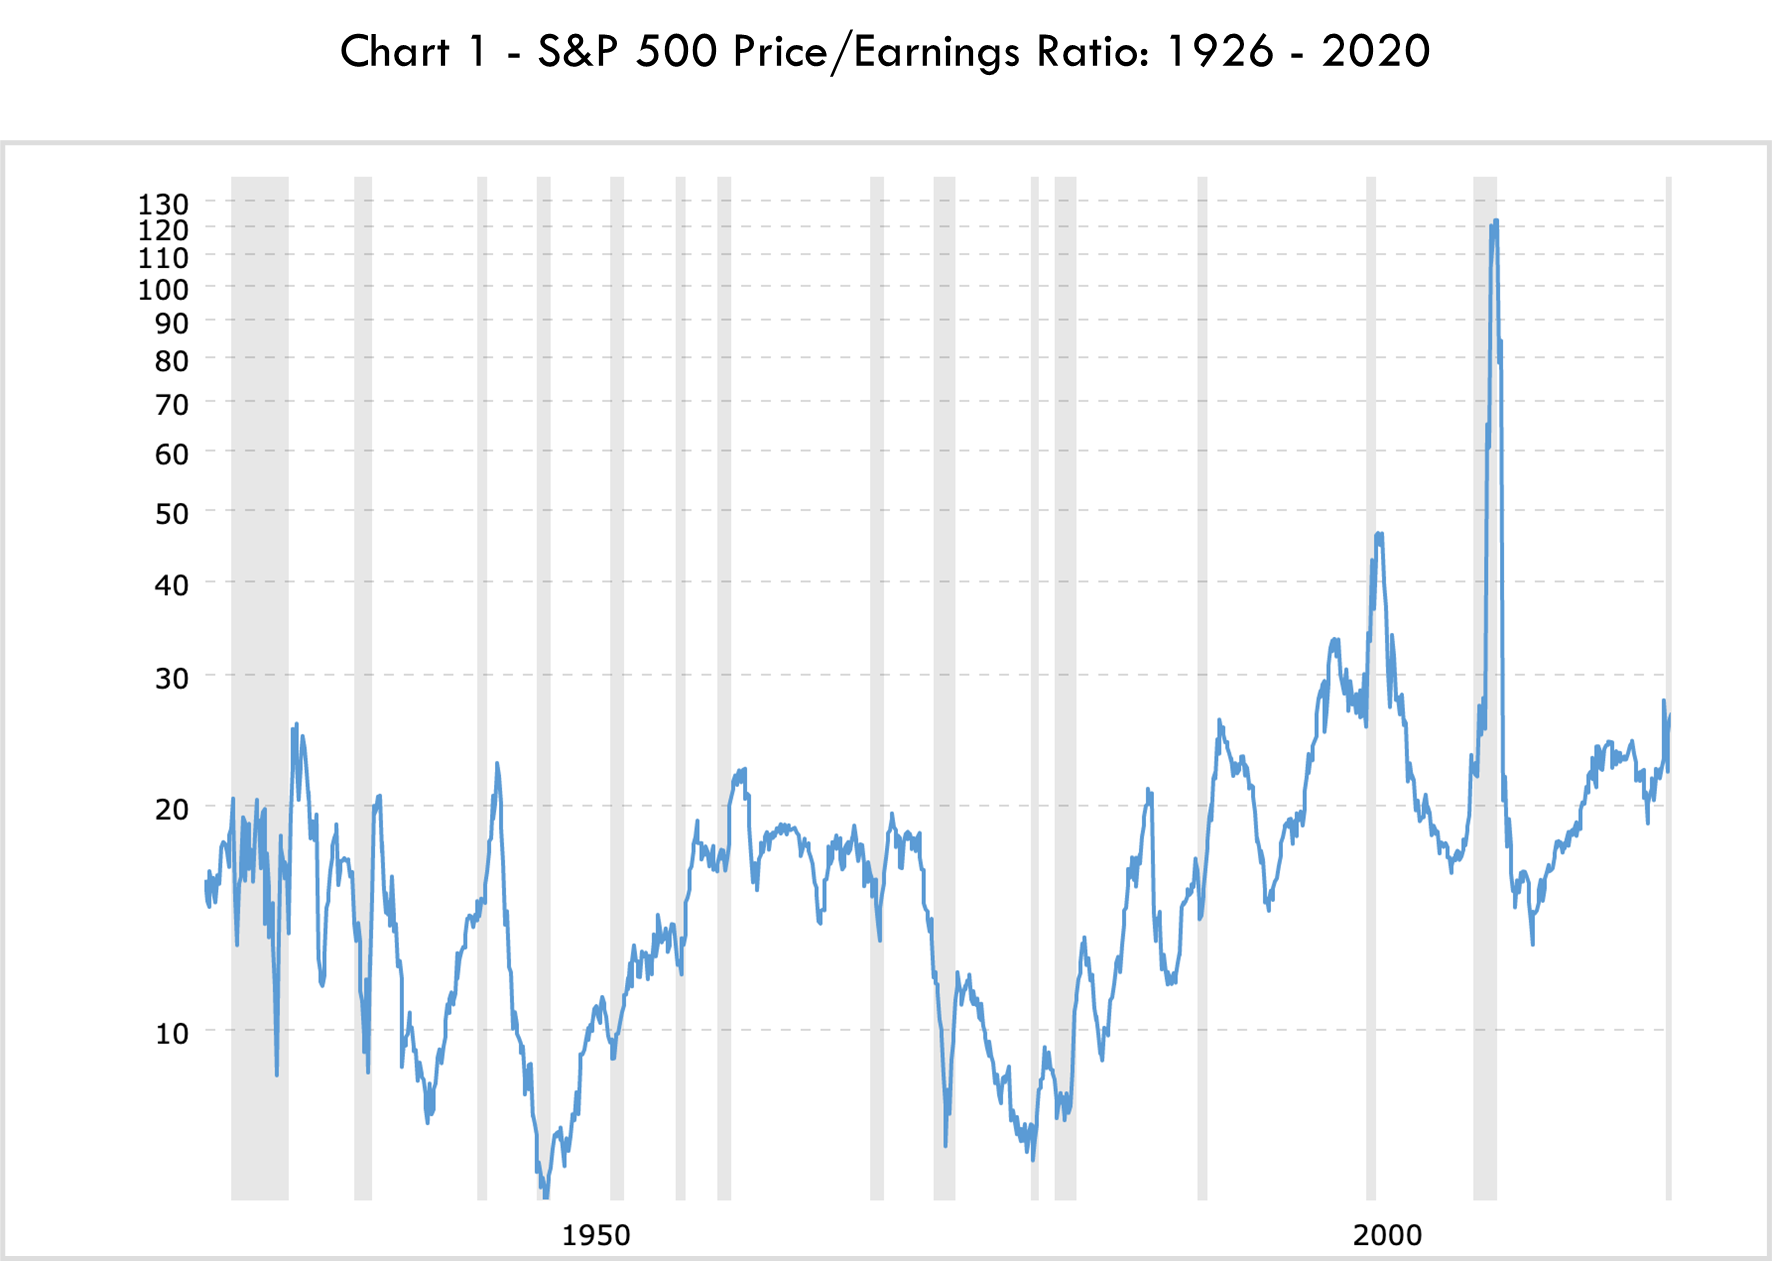
(VII) The Price-Earnings Ratio
If you are sceptical about this conclusion, you need not take my word for it. The price earnings ratio of the S&P500 (Chart 1) shows us all we need to know. Historically, investors have used the P/E ratio to ascertain whether prices accurately reflect the underlying value of an asset. Mathematically speaking, the ratio rises when earnings fall or prices increase, and it declines when earnings increase and prices fall. If it is too high, this suggests that the asset is overvalued.
Since 1926, the P/E ratio has risen above 25 only a handful of times. It did so in the early ‘90s, again during the dot-com bubble, during the GFC, and now, during the COVID-19 crash. As of December 2nd, it sits at 37.14 – the highest it has been since the 2008 crash.[xx] The times that precede or follow economic crises see the P/E ratio increase dramatically. Of course, this is not because earnings increase during recessions; rather, earnings fall while prices are inflated by government intervention. Both factors conspire to raise the P/E ratio to unprecedented levels. Accordingly, the P/E ratio is not simply a measure of asset valuation: it is now a measure of government interference, and the overall health of financial markets. It is impossible to say what the future will bring; but from our vantage point, markets during COVID-19 look rather sick. Let us hope we can find a way to restore their health.
Recommended Reading
Chapter 12 of Keynes’ General Theory of Employment, Interest & Money is both incredibly illuminating and very short. L. Randall Wray’s Why Minsky Matters is a simple overview of Minsky’s work, which has become indispensable in understanding the dynamics of the financial system that led to the global financial crisis in 2008. Stiglitz’s book Freefall is a good overview of that crisis, and the problem of moral hazard that the Fed has created through their bailouts and quantitative easing programs.
References
Graham, R. J., & Harvey, C. R. 2001. The theory and practice of corporate finance: evidence from
the field. Journal of Financial Economics, 60(2-3), 187-243. Retrieved from https://doi.org/10.1016/S0304-405X(01)00044-7
Keynes, J. M. 1957. The General Theory of Employment, Interest and Money. London: Macmillan & Co Ltd.
Massumi, B. 2018. 99 Theses on the Revaluation of Value: A Postcapitalist Manifesto. Minneapolis, MN: University of Minnesota Press.
Stiglitz, J. 2010. Freefall: America, Free Markets and the Sinking of the World Economy. New York, NY: W. W. Norton & Co.
Varoufakis, Y. 2015. The Global Minotaur: America, the True Causes of the Financial Crisis and the Future of the World Economy. London: Zed Books.
Vogl, J. 2014. The Specter of Capital. Stanford: Stanford University Press.
Wray, L. R. 2016. Why Minsky Matters. Princeton, NJ: Princeton University Press.
Endnotes
[i] See https://markets.businessinsider.com/news/stocks/coronavirus-recession-worst-wwii-economic-recovery-global-deutsche-bank-2020-3-1029012757?utm_source=msn.com&utm_medium=referral&utm_content=msn-slideshow&utm_campaign=bodyurl#
[ii] See https://markets.businessinsider.com/news/stocks/us-gdp-drop-record-2q-amid-coronavirus-recession-goldman-sachs-2020-3-1029018308?utm_source=msn.com&utm_medium=referral&utm_content=msn-slideshow&utm_campaign=bodyurl
[iii] See https://www.bea.gov/data/gdp/gross-domestic-product. When the BEA released this statistic in July, it also had no discernible effect on financial markets.
[iv] A recent report on New York’s securities industry confirms this reversal of fortune. Their profits between January and the end of June in 2020 totalled $27.6 billion – only slightly less than the total profits earned in 2019. See https://www.osc.state.ny.us/files/reports/osdc/2020/pdf/report-6-2021.pdf
[v] See Freefall: America, Free Markets and the Sinking of the World Economy.
[vi] On page 152, Keynes writes: ‘In practice we have tacitly agreed, as a rule, to fall back on what is, in truth, a convention. The essence of this convention – though it does not, of course, work out quite so simply – lies in assuming that the existing state of affairs will continue indefinitely, except in so far as we have specific reasons to expect a change.’ This convention allows us to attain ‘a measure of continuity and stability in our affairs, so long as we can rely on the maintenance of the convention.’
[vii] While this convention sounds ridiculous, it remains prevalent today. Popular financial models, such as the Black-Scholes model and the CAPM formula,a are usually implemented using historical data to estimate future prices. This means investors using these models like this assume the future will look like the past, even though crises like the dot-com crash, the GFC, and the COVID-19 recession show that this convention has failed dramatically on three occasions in under 25 years. Lacking clairvoyance, we have little besides this belief; hence, our meagre powers of prediction make asset pricing irrational.
a Studies show that financial analysts regularly use both formulas. A famous 2001 study by Graham and Harvey found that 74.9% of the 392 CFOs surveyed used CAPM ‘always or almost always’.
[viii] The General Theory of Employment, Interest & Money, pp. 154 – 156.
[ix] The General Theory of Employment, Interest & Money, pp. 161 – 163. See also: Brian Massumi’s 99 Theses on the Revaluation of Value.
[x] The words are Keynes’, quoted in Massumi’s 99 Theses on the Revaluation of Value.
[xi] Why Minsky Matters, p. 86.
[xii] Wray explains it like this: High aggregate demand and high profits associated with full employment raise expectations and encourage increasingly risky ventures based on commitments of future revenues that are too optimistic. When the expected revenues are not realised, a snowball of defaults then leads to debt deflation (debtors default on their debts, which are assets of creditors) and high unemployment. See Why Minsky Matters, p. 86.
[xiii] Named after former Fed Chair, Alan Greenspan, this epithet has an interesting history.
During the 1987 stock market crash, Greenspan affirmed the Fed’s commitment to ‘serve as a source of liquidity to support the economic and financial system’whenever a crisis hit. Here, Greenspan gave the market certainty: he would use all his powers to ensure the stability and profitability of an increasingly volatile and fragile system. From this point onwards, investors could rely on the Fed to bail out banks and refloat the financial economy if problems arose. Greenspan repeatedly lived up to his promise, so his commitment became known as the ‘Greenspan Put’.
Under Greenspan’s leadership, a financial crisis would always cause the Fed to buy assets at a good price. His successors have dutifully followed suit, starting with Obama’s Fed Chair, Ben Bernanke, who bailed out the banks during the GFC. And now, during the COVID-19 economic crisis, Jerome Powell has exceeded his forebears in every regard.
See: https://www.federalreserve.gov/Pubs/feds/2007/200713/200713pap.pdf
[xiv] In 2008, the Fed also justified their actions via a mode of ‘trickle-down’ economic thought. The argument is that QE depresses long-term yields relative to short-term yields. This incentivises the borrowing of debt, which is then used for investment, creating jobs, income growth, etc., supporting the wider economy. There is also a consumption wealth effect: investors who make greater returns will spend their dividends etc. in the economy, stimulating growth. Some economists were highly critical of this mode of argumentation, saying that it created a dangerous asset bubble that did little for economic growth.
[xv] In general, QE can only be used to buy paper assets from other banks. It cannot be used for loans, etc., and hence, it does not cause inflation.
[xvi] Of course, the Coronavirus Aid, Relief and Economic Stimulus Act 2020 contributed to this rise: announced on March 28th, this package, which was three times larger than Obama’s GFC stimulus, pumped another $2.4 trillion into the economy.
[xvii] See https://www.fitchratings.com/research/sovereigns/global-qe-asset-purchases-to-reach-usd6-trillion-in-2020-24-04-2020
[xviii] See https://www.rba.gov.au/media-releases/2020/mr-20-28.html
[xix] An afterthought: to call this system capitalism at all, ersatz or not, doesn’t seem radical enough. What we have cannot be called a ‘poor imitation’ of capitalism, because it has nothing to do with capitalism at all. At its most basic level, capitalism is a system of privately owned, risk-taking firms, united by a commitment to generate profits through competitive, real production. The value of a company in a capitalist system, as revealed in its share price, should reflect their success in these regards.
But due to the Fed’s commitment to QE, for at least a few months this year, information about profitability and production became irrelevant to our financial markets. As the crisis unfolded, share prices were severed from underlying economic performance. The value of companies became disconnected from their successes as capitalist institutions. In 2020, financial returns were not based on ingenuity or skill: they were secured by the brute force of the government.
The government intervention that has produced this dangerous mode of moral hazard has completely changed the logic underlying asset pricing. Our expectations of profitability are divorced from those concerning volatility, capital gains, returns, etc. Capitalist logic no longer governs our financial markets. They are not even ersatz capital markets: and so, we need a new word to describe our system today.
[xx] See https://www.multpl.com/s-p-500-pe-ratio
Modern Monetary Theory
By A. F. Cannon
As our leaders look to repair our economies after the COVID-19 crash, a wild new way of economic thinking has surged to prominence: modern monetary theory, or MMT for short. MMT’s supposedly radical ideas for money creation and government spending have caused fear and confusion. ‘It’s dangerous,’ we hear. ‘We’ll end up like Zimbabwe!’ we’re told. Debt crises, financial ruin – or, perhaps, the chance for a better future. All this angst is intriguing. So, let’s take a closer look at MMT.
THE PATH TO MMT
The rise of MMT started after the global financial crash in 2008. As Netflix’s film The Big Short shows, bad financial modelling, systemic malpractice, and underestimating risk caused a collapse of the banking system. Blatant and severe problems in the financial sector grew unchecked, and eventually, the whole thing exploded. Remarkably, almost nobody saw the crash coming. Alan Greenspan, former Fed Chair and ‘greatest central banker in the history of the world,’1 was dismayed. He said the ‘whole intellectual edifice’ underpinning our financial markets had collapsed. Unable to understand its own flaws, contemporary economic and financial modelling lost its credibility during the crisis: the crash bankrupted it, alongside Bear Stearns and Lehman Brothers.2
After the GFC, we needed a new way to think about economics. We were desperate for a new paradigm that avoided the fatal flaws of the old ways of thinking. Over the last decade, people worldwide have laboured hard to meet this demand, and several of their ideas have become prominent. Some of them are quackish, others are underwhelming, but a few have promise.
Modern monetary theory has been the most successful and the most controversial of these ideas. Until recently it was an academic obscurity, but now it has gone mainstream. Politicians like Bernie Sanders and Alexandria Ocasio-Cortez have adopted MMT-inspired policies. Leading theorist Stephanie Kelton’s recent book, The Deficit Myth, has also been widely acclaimed. These figures are all highly visible in the media, where they regularly make surprising calls for policy change. They say we need a ‘universal job guarantee’ and a ‘Green New Deal’, both financed by – what? – printing money. That’s right. Printing money.
WHAT IS MMT?
At the moment, there is no consensus on MMT. Depending on our source, MMTers are either charlatans or savants; they are profoundly pragmatic or dangerously utopian. Some say Kelton’s work is ‘on a par with the genius of DaVinci and Copernicus’. Others simply tell us MMT is ‘dead wrong’. And a poll of leading economists like Angus Deaton and Daron Acemoglu suggests the academy is overwhelmingly against it.3 There is some potent opposition to MMT, then. But if we read what MMTers themselves have to say, it’s hard to see why it inspires these extreme responses.
According to economist James K. Galbraith, MMT is just ‘a description of how a modern credit economy actually works’.4 While its arguments might be surprising, they aren’t illogical. In essence, the theory tells us that governments with their own currency don’t need money reserves or tax revenues before they can spend. After all, the government is always the source of money in the economy. Logically, taxation can’t occur before money creation. Instead, the government has to create money ex nihilo – ‘from nothing’ – and spend it into existence before receiving their tax revenue. The whole monetary system doesn’t make sense otherwise.
‘From nothing?’, you say. Yes: from nothing. MMT says money only exists because the government creates it from nothing. ‘How does this work?’ you ask. Well, it’s pretty simple. First, the state uses its power to impose taxes on its people. Then, it demands payment of these taxes in the currency it issues. Workers and producers then find that they need government currency, and they get it from a combination of government spending and private lending. Once they have the money, they pay taxes on a portion of their output, and they keep the rest. The government gets its tax, and the workers use the remaining money for investment, consumption, etc.5
All this leads us to a new take on government deficits. As taxes are never equal to 100% of output, the government initially falls into a budget deficit. They can’t tax away dollars that they haven’t spent first. The government, then, can only achieve a budget surplus if the private sector is in deficit. To run a surplus, the government has to reduce money creation, pull existing money out of the system by raising taxes, or seek loans from the private sector.6 Accordingly, the government doesn’t need to finance their deficits through borrowing. For them, reasonable, perpetual deficits are a sign of a healthy economy. Budget surpluses, on the other hand, impede economic growth by draining resources away from private investment. Worse still, surpluses frequently precipitate periods of crisis, as the private sector engages in risky lending to finance the government.7
If all this is true, it has some important implications for government policy. MMTers tell us that countries who:
- a) hold a sovereign currency (in MMT-speak, a fiat currency that isn’t convertible into something the government can run out of, like gold or foreign currency), and
- b) who borrow only in that currency,8
can and should issue money to create ‘a full employment economy.’9 According to MMT, a government can spend money into existence to bring the economy to its productive capacity. It also says that countries using a sovereign currency can’t default on their obligations. As Galbraith tells us, countries like Australia and the USA are ‘not Greece, and cannot become Venezuela and Zimbabwe’. Incidentally, Warren Buffet and Alan Greenspan agree:10 a country with a sovereign currency can always finance its deficits by creating currency. We can’t run out of our own money.
THE CASE AGAINST MMT
For those weaned on monetarism – practically everyone reading this article, myself included – this sounds like pure anathema. Isn’t ‘inflation always and everywhere a monetary phenomenon’?11 Won’t printing money to fund our deficits lead us to ruin, Argentinian style? Mainstream economists – none of whom foresaw the GFC in 2008, by the way – seem to think so.
For Harvard economist Kenneth Rogoff, these ideas on deficits are ‘just nuts’. In his view, this ‘modern monetary nonsense’ forgets that the ‘printing press is not a panacea’, as its use can lead to problems with debt repayment and currency demand. Nobel Laureate Paul Krugman tells us he doesn’t ‘understand [MMT’s] arguments at all’. Elsewhere, he expresses ‘mild concern’ over the MMT position ‘that because we have a printing press deficits don’t matter’. Lastly, for Larry Summers – Yanis Varoufakis’ very own ‘Prince of Darkness’ – MMT is ‘voodoo economics’ and a ‘recipe for disaster’. It offers ‘the proverbial free lunch’, he says, ‘the ability of the government to spend more without imposing any burden on anyone.’
The fearsome free lunch, people: be afraid.
Economists hate free lunches. We know this. We all agree that a free lunch is the worst kind of lunch. Today, no serious economist argues for policies that try to give people something for nothing. History tells us this is usually disastrous. We know that printing money to finance expenditure will cause inflation. Government’s credibility will decline. The costs of borrowing will increase, and the currency’s value will fall.12 We know there is nothing desirable about printing endless piles of money – ‘keystroking’ it into existence with computers, as MMTers say. And we know that countries around the world have ruined themselves by pursuing this strategy.
THE CASE FOR MMT
It is lucky, then, that MMT proposes nothing of the kind. Stephanie Kelton is at pains to reassure us: ‘MMT is not a free lunch’, she says throughout her Deficit Myth. Galbraith also tells us he knows of no MMT advocate so naïve as to say that ‘deficits don’t matter’. Along with the MMT community at large, Kelton and Galbraith understand that governments looking to spend must be sensitive to our economy’s real resource constraints.
Proponents of MMT don’t advocate for unlimited money printing. Instead, they argue that the government can spend money until all the economy’s real resources are used in productive activities. The economy has real constraints, a point Kelton makes at least seven times in her book. She also emphasises that ’failing to identify – and respect – those limits could bring great harm’ to our economy’ in the form of inflation.13 Like all economists, MMTers say governments can spend money to push the economy to its productive limit. Unlike others though, they also say governments should do this. That it’s their responsibility to spend until we hit full employment.
INSIGHT
As we have seen, MMT purports to offer a compelling solution to our economic problems. But do its arguments stack up? And will it work?
When I think about the viability of MMT, I have to remind myself of a few facts. Since my birth in 1994, our society has lived through the rupture of the dot-com bubble in 2000. Next, we saw the global financial system collapse in 2008. Then, the Eurozone crisis persisted through the 2010s. Now, we’re in a recession caused by the COVID-19 lockdowns in 2020. Over this period of crises, interest rates and capital investment measured as a share of GDP have fallen to historic lows in many countries, taking economic growth down with it.14 Over my life, economies worldwide have become more ineffective, partly because of our way of thinking about economics. We need to change. Maybe, MMT is the winning idea.
In truth, I’m hesitant to endorse MMT fully. To me, it seems that MMT offers the same story as always, albeit with some minor adjustments. It gives us some great ideas on money’s origins and the way governments work. And it drives a stake through the heart of austerity politics. But the fact remains: the government can only print money to finance expenditure up to a point. If the spending doesn’t increase real productivity, expansion beyond this limit will cause inflation. Once they reach this resource constraint, the government can only spend more money through – you guessed it – taxing the private sector. If they don’t increase taxes, the government will find themselves competing against the private sector, and prices will rise.
In the absence of tax hikes, I am sceptical that MMT-based expenditure could finance projects like a Green New Deal without inflation. After all, high-skill workers generally have jobs doing other essential activities. And I am puzzled by their ‘job guarantee’ idea. Of course, their vision of full employment is attractive. But I wonder about the real value of the projects the workers would complete. Its design and administration must be thoughtful, or it could end up like the universal employment programs in the USSR, where ‘they pretend to pay us, and we pretend to work’. In short, there is a fear that governments will fail to use the theory correctly. MMTers may inadvertently prove their critics right if they aren’t careful.
Despite these reservations, overall, I am open to MMT. At the moment, inflation isn’t a risk. Interest rates are low, and our economic resources are underutilised. And our intellectual paradigm hasn’t ensured economic stability for nearly twenty years. Perhaps, then, our governments should pay attention to MMT. After all, the ideas that provoke us usually tell us something important. Maybe it’s time to listen.
RECOMMENDED READING
An excellent introduction to MMT is James K. Galbraith’s article, ‘Modern monetary realism’.
Stephanie Kelton’s The Deficit Myth is a highly accessible book-length introduction to the topic.
- Randall Wray offers a more comprehensive account in his Modern Money Theory. Thoughtful
criticism of MMT from a left-wing perspective can be found in Doug Henwood’s article, ‘Modern
Monetary Theory Isn’t Helping’. For a critical ‘free-market’ perspective, see Peter Smith’s article,
‘Unmasking Modern Monetary Theory’.
NOTES
1 Phil Gramm is responsible for these words. See: https://www.economist.com/united-states/2000/01/06/almighty-alan-greenspan
2 See https://oversight.house.gov/sites/democrats.oversight.house.gov/files/migrated/20081023100438.pdf
3 Respectively, these remarks belong to David Cay Johnston and Robert P. Murphy. For the poll on leading economists, see http://www.igmchicago.org/surveys/modern-monetary-theory/
4 See https://www.japantimes.co.jp/opinion/2019/03/18/commentary/world-commentary/modern-monetary-realism/
5 For MMTers, then, money is an expression of state power – a means of forcing debt upon people through tax obligations. According to L. Randall Wray, it is correct to say that ‘all money is debt’. (Wray, 2015, p. 58).
6 Note that private sector money creation also occurs ex nihilo. When a customer takes out a bank loan, the customer sells a financial security to the bank – their promise to pay – and the bank creates an account for them, without drawing money from elsewhere. The bank makes with the expectation that the debtor will generate sufficient returns with the sale of their financial security. On this point, see chapter three of Wray’s Modern Money Theory, and Prof. Richard Werner’s intriguing paper, ‘Can banks individually create money out of nothing? — The theories and the empirical evidence’. Available https://www.sciencedirect.com/science/article/pii/S1057521914001070
7 See chapter three of Kelton’s Deficit Myth.
8 If they hold debt in another currency, then government expenditure in the home currency will depreciate the exchange rate, increasing the debt burden and the likelihood of default. For this reason, MMT advocates advise against holding debts denominated in foreign currencies. Their theory, then, is not universally applicable.
9 Kelton, 2020, p. 38.
10 Kelton, 2020, pp. 147 – 148. See also https://www.youtube.com/watch?v=Q2om5yvXgLE
11 Milton Friedman’s words, quoted by Stephanie Kelton on page 161 of The Deficit Myth.
12 Wray tells us that hyperinflation typically requires additional circumstances beyond the printing of money. If increased government expenditure is accompanied by: a collapse in productive capacity, sociopolitical upheaval, the existence of onerous debt obligations denominated in foreign currencies and an inability to raise taxation for political reasons, or a weakening of the government’s power to collect tax, the real resource constraint narrows and inflation will increase.
13 Kelton, 2020, p. 70.
14 According to World Bank Data, US GDP has grown by less than 3% for all but one year since 2006, while countries like Germany and Australia have done little better. See https://data.worldbank.org/indicator/NY.GDP.MKTP.KD.ZG?locations=US-DE-AU
REFERENCES
Galbraith, J. K. (2019). ‘Modern monetary realism’. Retrieved from https://www.japantimes.co.jp/opinion/2019/03/18/commentary/world-commentary/modernmonetary-realism/
Greenspan, A. (2008). ‘Testimony of Dr. Alan Greenspan’. Retrieved from https://oversight.house.gov/sites/democrats.oversight.house.gov/files/migrated/20081023100438.pdf
Henwood, D. (2020). ‘Modern Monetary Theory Isn’t Helping’. Retrieved from https://jacobinmag.com/2019/02/modern-monetary-theory-isnt-helping
Kelton, S. (2020). The Deficit Myth: Modern Monetary Theory and the Birth of the People’s Economy. New York, NY: Hachette Book Group.
Krugman, P. (2019). ‘Running on MMT (Wonkish)’. Retrieved from https://www.nytimes.com/2019/02/25/opinion/running-on-mmt-wonkish.html
Krugman, P. (2019). ‘How Much Does Heterodoxy Help Progressives? (Wonkish)’. Retrieved from https://www.nytimes.com/2019/02/12/opinion/how-much-does-heterodoxy-help-progressiveswonkish.html?action=click&module=RelatedLinks&pgtype=Article
Murphy, R. P. (2019). ‘The Upside-Down World of MMT’. Retrieved from https://mises.org/library/upside-down-world-mmt
Rogoff, K. (2019). ‘Modern monetary nonsense’. Retrieved from https://www.afr.com/opinion/modern-monetary-nonsense-20190306-h1c1vi
Smith, P. (2019). ‘Unmasking Modern Monetary Theory’. Retrieved from https://quadrant.org.au/magazine/2019/07/unmasking-modern-monetary-theory/
Summers, L. (2019). ‘The left’s embrace of modern monetary theory is a recipe for disaster’. Retrieved from https://www.washingtonpost.com/opinions/the-lefts-embrace-of-modernmonetary-theory-is-a-recipe-for-disaster/2019/03/04/6ad88eec-3ea4-11e9-9361-301ffb5bd5e6_story.html#comments-wrapper
Varoufakis, Y. (2017). Adults in the Room: My Battle With Europe’s Deep Establishment. London: Vintage.
Wray, L. R. (2015). Modern Money Theory: A Primer on Macroeconomics for Sovereign Monetary Systems. Palgrave Macmillan.
Financial Forecasting – Introducing a Powerful New Module of the RealTime CEO Software
For many executive teams, financial forecasting is a cumbersome, time-consuming and wildly inaccurate process. It’s so frustrating that some private mid-market companies have given up on it entirely.
With the new forecasting module in our RealTime CEO software, creating a comprehensive forecast is as simple as clicking a button.
Our new forecasting module takes your current and historical financial data trends and projects it 12 months into the future, automatically building comprehensive forecasts for operational P&L and balance sheet items, along with all of your key RealTime CEO metrics.
This eliminates the biggest source of headaches in the forecasting process – building the initial 12-month forecast (including the balance sheet items).
The software delivers your financial forecast without the need for accountants or Excel gurus. It allows business leaders to have a business conversation about the future while adjusting business assumptions with a few clicks or numerical adjustments.
Enabling Financial Forecasting
Access your financial forecast by clicking on the Forecast Assumptions option in the main navigation on the left.
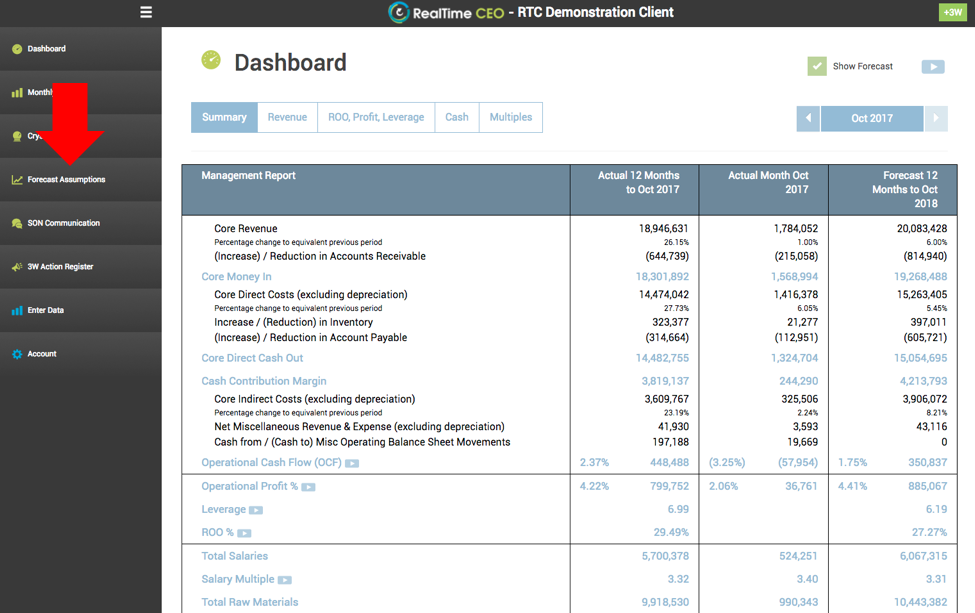
The software will then allow you to select your 12-month revenue target, giving you the options of:
- Using your current trailing 12-month revenue
- Manually entering a target
- Selecting a percentage change from your current trailing 12-month revenue
Once you’ve determined the value of the revenue, you then have the option to set your monthly targets evenly or use the “seasonal shape” of the forecast by replicating the monthly totals from the previous year.
This provides the starting point for your business conversations about the landscape ahead.
Adjusting the Forecasting Assumptions
During your monthly SON communication business discussions, you can adjust your forecast as needed by selecting the category to edit.
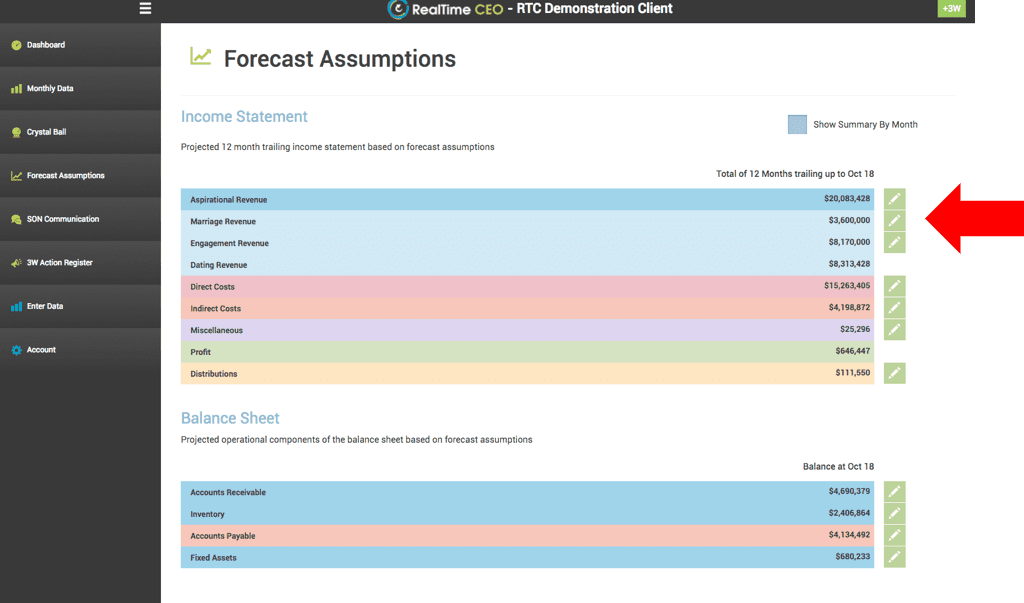
Then, adjust specific months either by selecting a percentage change or by typing in a specific number.
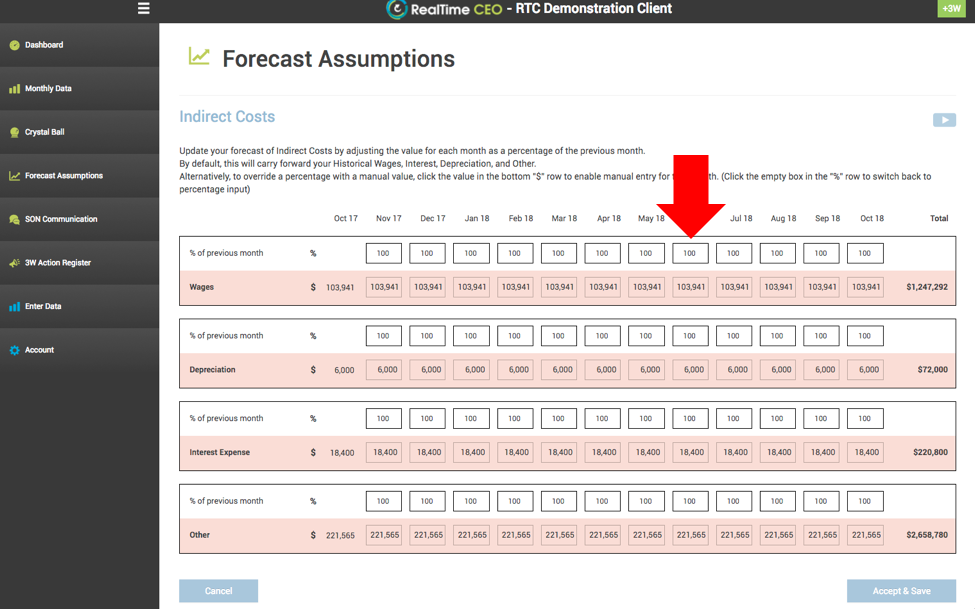
Using Forecasting
Once you’ve enabled forecasting, you have the option to view it throughout the software.

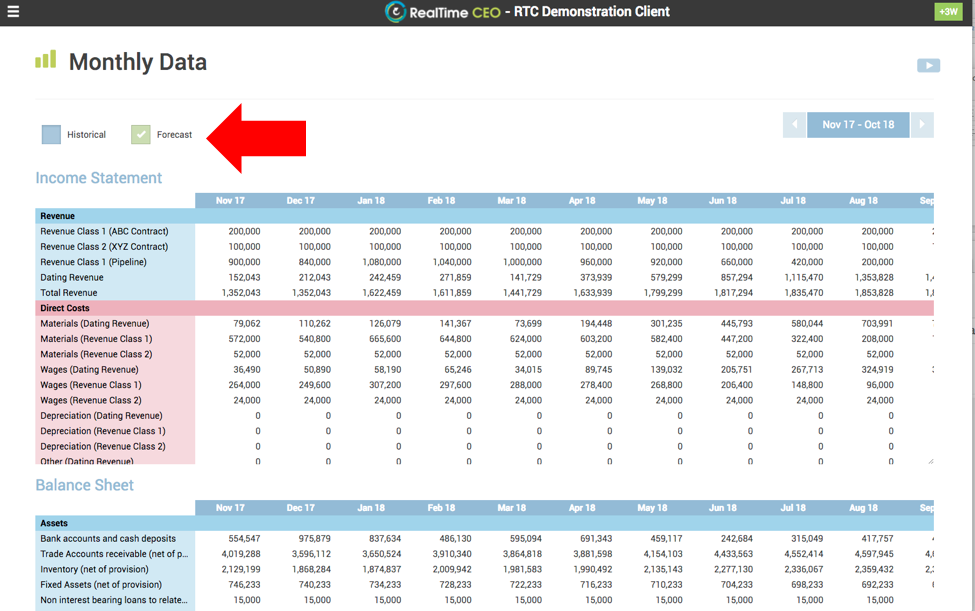
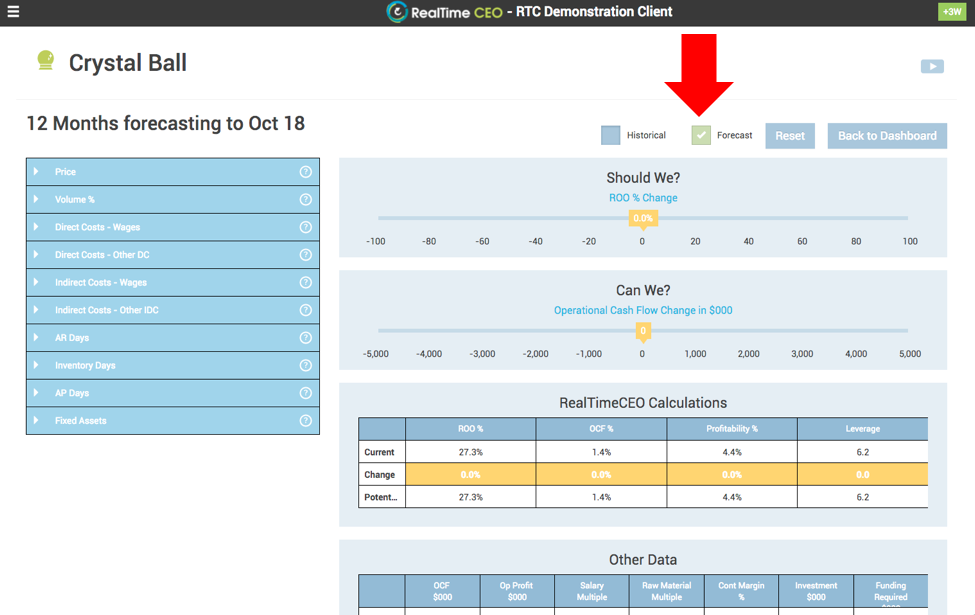
Full Demonstration
Here is a complete video demonstration of how to use the financial forecasting module.
To get started, subscribe here.
Getting the Most Out of the SON Communication Process

If you’ve attended one of my workshops, you’ve heard me talk about the value of the SON communication process – a simple exercise that can dramatically improve your business.
(Here’s an introduction to SON communication along with a discussion of how to select your team and lead your SON communication meeting.)
One of the greatest values of your monthly SON communication meeting is that it can remove silo mentality. To do that, you must have a robust monthly leadership conversation. Some of you have asked for more guidance to ensure that your team has a lively discussion, so that’s the focus of this post.
SON communication is built around 3 questions to challenge the strategic, operational and numeric changes happening around your business.
Question 1: “What information has come to light in the last 30 days that changes our view of the future?”
There is no fixed way to answer this question but try and resist going to the numerical too quickly. Keep the conversation at a higher strategic level. (Question 3 will give you plenty of chance to go numerical).
Below I have provided a series of bullet points to assist you in the early implementation of this process. As time goes on, make this list your own. Remove bullets that don’t relate to your business and add others that do. The bullet points are listed under 2 headings: things that impact demand for your goods and services and things that impact your ability to supply.
Demand Factor Questions
- Are opportunities increasing or decreasing? (This facilitates a discussion the size of the pie, or market size.)
- Is our market share changing? (Focuses on your slice of the pie.)
- Has our strategic marketing or tactical sales approach changed?
- Is our product/service mix changing?
- Has our market mix changed and are we considering new markets?
- Are there any opportunity to launch new products or services?
- Has our pricing landscape changed? (An opportunity to increase prices vs. pressure to discount.)
- Have we heard a “quirky” anecdote as to why our business has been preferred/differentiated from the competition?
- Have our existing or new competitors changed their approach?
- Have projects slipped back or come forward?
Supply Factor Questions
- Have there been any changes to our current or potential human resources?
- What is happening in our supply chain – availability / reliability / price?
- Have we changed any internal systems (i.e. has a mistake resulted in an improvement in internal systems to ensure it doesn’t happen again?)
Question 2: “How will our behavior change to create value or mitigate risk?”
Question 3: “What will be the numerical implication of these changes?”
Use the Crystal Ball feature of the RealTime CEO software to challenge possible actions identified during questions 2 and 3 of the SON discussion. This will ensure that you get the most out of your monthly meetings.
Eight Levers That Control the Value of Your Business
If you’re a CEO focused on making an immediate improvement in your performance, which we typically measure by quantifying the amount of value you’re creating in your business (and we call this your ROO%, or Return on Operations percentage), there are eight key actions you can take, or levers that you can “pull,” that will directly affect both your cash flow and your ROO%.
Four of these deal with inputs and the other four deal with outputs.
Inputs
- Revenue Collection (AR)
- Inventory Management
- Supply Chain Management (AP)
- Fixed Asset Utilization
Outputs
- Price Strategy
- Volume Strategy
- Direct Cost Control
- Indirect Cost Control
Shown graphically, they look like this:
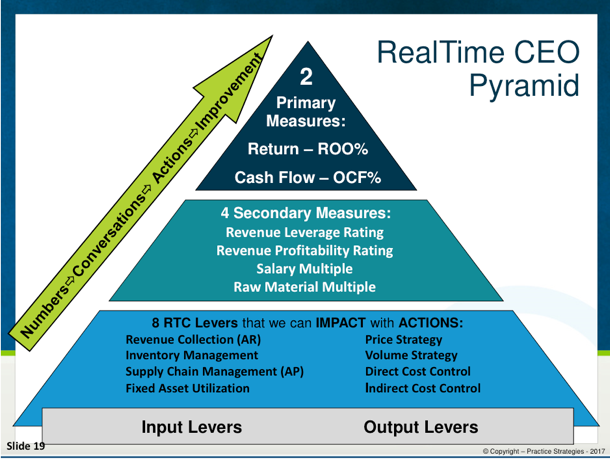
The input levers focus on making improvements to balance sheet items while the output levers focus on making improvements to income statement items.
Here are some examples of actions your team can take to increase your ROO%.
Inputs
- Revenue Collection – Tighten your collection procedures to reduce your overall total AR days by at least 1%.
- Inventory Management – Implement a lean approach to inventory holdings.
- Supply Chain Management (AP) – Add extra days to your payables (you know the AP rule – pay as slowly as you can WITHOUT jeopardizing your supply arrangement).
- Fixed Asset Utilization – Consider additional shifts to better utilize existing assets that may be idle for many hours a day.
Outputs
- Price Strategy – Increase your prices 1% across the board.
- Volume Strategy – Introduce a cross-selling campaign to your existing customers by promoting another of your products or services to increase your units sold.
- Direct Cost Control – Renegotiate your buy agreements with suppliers to reduce your direct costs and maybe even extend payment terms.
- Indirect Cost Control – Reduce the scope of work of an external vendor (by shifting some work in-house where it’s completed at a lower cost) or ask for vendors to provide a discount in exchange for a longer term.
When we’re working with clients or educating a Vistage or TEC group, we use a sensitivity analysis to show how a 1% change in each of the above can improve cash flow and operating profit and ultimately ROO% and the value in the business.
For some businesses, it’s significant. Actually it’s a game changer!
If you’re a RealTime CEO Software user, you can model this with your real financial data using the Crystal Ball feature. Once you’ve completed the onboarding process, select the Crystal Ball option from the left hand navigation, click on the arrow next to each level and input your potential change.

The resulting change to your ROO% and operational cash flow will display in the top graphs, with your core data displaying below it, allowing you to quantify the value of your actions on the bottom line with 2 questions: “Should We Do It?” and “Can We Do It?”
If your Vistage group has not yet received an invitation to participate, contact me to schedule, or you can set up individual RealTime CEO Cloud Service accounts here.
How much is invested in your business?
A common question that can cause unnecessary confusion for business owners is “How much is invested in your business?”. The same business owner can typically tell me approximately what their house is worth or how much they have invested in their share portfolio but they struggle to confirm how much is invested in their business. This is a problem, because it is very difficult to understand how much return you are generating if you don’t know how much is invested. So why is this so difficult? The answer lies in the traditional balance sheet which is not presented in a way that is easy to interpret and certainly does not readily tell us how much is invested in the business.
Have a look at this short screen cast for some insight to how the executives of DuPont addressed this issue over 90 years ago. Their insights have become common practice in public companies around the world but are still not understood by most private companies.
Unlocking the Power of Your Balance Sheet

Do you understand the power of the information contained in your balance sheet?
It may sound like a silly question, but your answer depends on your viewpoint. I typically hear midmarket CEOs and CFOs say (or think) one of the following:
- What power? We don’t even use the balance sheet. Cash flow and the P&L are the only statements we need. Cash is king.
- This guy is silly. We run the balance sheet every month and review the assets, liabilities and equity.
- Of course. We create the standard balance sheet because we’re required to, but we follow the DuPont model (just like every other public company in the world) to recast our receivables, inventory, fixed assets and payables to determine how much is invested in our business and how well our managers are performing to produce a return for our ownership.
Which bucket do you fall into?
Cash is king, so most entrepreneurs and small business owners fall into bucket #1. And, most public companies and large private companies fall into bucket #3.
But I see mid-market companies falling into all three buckets.
Sometimes, I even hear their accountants tell me that you can’t forecast the balance sheet into the future. And you shouldn’t change your balance sheet, because you must adhere to GAAP!
I don’t mean to be critical, but if you fall into bucket #1 or bucket #2, and have interest in learning about the more sophisticated methods for unlocking the value in your business, they’re available. Would it be valuable for you to understand, in real time, how much value you’re creating in your business, and how that will change in the future by the decisions you make today?
We’ve been doing this directly with clients for over a decade. And coming in May, we’ll have a new web app that will allow small to midmarket companies to move into bucket #3 by following a few simple procedures.
You can learn more and RSVP here.
(And if you want to explore the DuPont analysis, you can do so here.)
RealTime CEO Cash Flow
Fiscal Focus is the plain English measurement module of RealTimeCEO. In our Fiscal Focus blog we looked at the Fiscal Focus pyramid, which describes the two main business aims: to generate return and to generate cash flow. In this blog we will discuss cash flow, which is the lifeblood of your business. Some people say to me, “Cash flow’s fine, Nick, but what about profit? That’s what really important.” Well, let me put this analogy to you. Profit is like food to business, which is important. But cash flow is like oxygen. You can go without food for a while but how long can you go without oxygen?
So, if we accept that cash flow is vitally important, let’s look at an easy way to measure our cash flow. Each of the eight Fiscal Focus levers [insert link here] is going to either put pressure on your cash flow or take the pressure off. For example, if your suppliers will give you goods today which you don’t have to pay for until later, that will ease the pressure on your cash flow. Alternatively, if you provide goods to your customers today that they don’t pay for until later, that’s going to put pressure on your cash flow.
So, how do we measure the cash flow in our business?
Have a look at this video for more insight into Cash Flow.
Tracking cash flow using this method has two advantages: one, it’s a very easy way to track it; and two, it gives you specific information you will need in conversations with your bank. But this calculation is most powerful when done over a twelve-month period; don’t fall into the trap of tracking it on a year to date or part-year basis.
Having problems keeping track of your cash flow? Are you worried about the possibility of liquidity problems? We can provide you with all the information you need to measure your cash flow and show you ways to increase it. For more information, check out our app (coming soon on the home page).
You can also follow RealTimeCEO on Twitter or Facebook for updates on blogs and news items.
Tweet
Core Management Principle 3 – the ‘Crystal Ball’
Welcome back to our series of blogs on Core Managment Principles. We have already looked at ‘3W Accountability’ and this one discusses ‘Decision Validation’ or what we call the RealTimeCEO Crystal Ball.
“An expert is somebody who has managed to make decisions and judgements simpler by knowing what to pay attention to and what to ignore.”
– Edward de Bono.
Don’t you wish you had a Crystal Ball?
Making decisions is a vital part of a CEO’s job. By knowing how to separate the important impacts from the other impacts, you will make a better decision. But how can you possibly make a decision about the future using data from the past? There may be other factors, for example, political or emotional considerations. Have you ever found yourself with a decision to make that has outdated, incomplete or inaccurate data, with political and/or emotional overtones? You probably relied on the thing which has got you where you are today – gut feel. We’re not saying gut feel isn’t important, but it does occasionally send you down the wrong path and it can be tough to get back from there. You need a Crystal Ball, right? Our process works with your instincts by helping you to test them.
For every decision, you need to ask two questions:
- Should we do this?
- Can we do this?
The Should We? question can be answered by looking at Return on Operations (ROO). If the result of your decision makes your ROO stronger, then your reason for being will be stronger and you should do it. If the decision will result in your ROO being diminished, then you shouldn’t. For more information about ROO see our blog, RealTime CEO / Fiscal Focus – Return.
The Can We? question depends on what it will do to your business’s cash flow. Do you have enough cash flow to fund this decision without jeopardizing your future cash flow? If the answer is yes, then you can. If the answer is no, then you can’t. For more information on cash flow refer to our blog, RealTime CEO / Fiscal Focus – Cash Flow.
Should we/Can we? brings clarity to decisions that may have been hazy in the past. In other words it gives you a Crystal Ball.
If you would like further clarity on this subject or any of our other tools, check out our app on our home page.
Are You Riding the Wave or Creating Your Market?

In my Vistage workshops, I talk a lot about predicting the future. And in my last post, I outlined the process I use with CEOs to enable them to more accurately predict the future of their business.
I accept that it’s impossible to continually predict the future with 100% accuracy. But I’ve seen a lot of CEOs learn to predict their financial performance for the next 180 days with a high level of accuracy, even up to 90%. That’s not bad.
And it’s always fun to work with a growing business, when revenues are increasing, profits are increasing, and the celebration culture is off the charts! Yet sometimes, that growing revenue can deliver a false signal about your performance or the performance of your business.
How?
It’s important to understand what is causing your profitable growth. To do so, during your monthly SON communication meeting, listen carefully to the answers about your market changes, competitors and marketing and sales performance when you ask the question what information has come to light in the last 30 days that changes our view of the future?
Profitable growth is almost always a good thing for a business. It’s a result of overall demand increasing for your products or services. But dig deeper in each meeting and explore why the demand is increasing. Ask the following question:
Is my growth market driven, or is it due to the performance of our marketing and sales?
In growing markets, I see plenty of businesses that are growing profitable and creating happy owners and executives. But that growth is not always occurring because they are particularly well run businesses; they’re growing because their market is growing, and that opportunity is so big that it is pushing everybody with the market.
To use a surfing analogy, it was more about the wave than the rider.
If you’re riding a wave, life is good, but be careful about getting complacent in the good times; it can mask flaws in your business that could rear their ugly head when the market growth slows. Research your market to see how your growth compares to the overall market and your competitors. If you’re growing faster than both, you’re probably doing the right things. If you’re growing at 20% but the market is growing at 100%, you’re falling behind the competition. When that growth levels off, you could be in trouble.
If your market isn’t growing, or you’re growing faster than your market, then congratulations! You’re generating the growth from your own activities. That means that your slice of overall pie is getting bigger, and you’re taking market share from your competitors.
After you celebrate your success, talk about the reasons why you’re succeeding. Has your strategic marketing or tactical sales process changed? Marketing is planting and watering the tree, sales is picking the fruit – which is driving the growth? What’s happening on your pricing landscape? Do you see opportunity to increase your price because of your brand?
If you can identify the causes of your success, then double down on them to increase your rate of growth over the next 90 days. Your business will be stronger because of it.
And then look for the next wave to ride, and life will get even better.
Predicting the Future of Your Business

During most of my Vistage workshops, I ask the group the following question:
Who in your business is best qualified to predict and influence the future?
What do you think is the most common answer that I hear?
The CEO.
And I agree. I think that the CEO is best qualified to predict and influence the future, and that’s his job. (However, I am also asking CEOs to answer this question…)
What do you think is the second most common answer?
The sales manager.
I agree. The sales manager and sales team typically have the pulse of what orders will be coming in during the rest of the month or quarter.
The third most common answer is the operations team. They are the ones interfacing with the sales team about fulfilling future orders.
Do I ever hear that the CFO or lead accountant is the best qualified person to predict and influence the future?
Rarely.
Yet most CEOs assign control of the budget to the CFO.
If an accountant or a CFO is not the best person to predict the future, why do you make them the custodian of the budget? It’s flawed logic and you’re setting up the forecasting process to fail. (I don’t want to upset any accountants here; they should play a critically important role in this process, but it is unfair to expect them to be the custodians of the process if they are not the best qualified to predict and influence the future.)
Why do so many CEOs continue to support this flawed process?
When I ask this question, I get two answers back: One is that the forecast is about numbers, and they’re the numbers people so if they don’t do this, what will they do? The second answer is that they are the best at Excel!
Which of these answers is worse?
Both are bad; if you’ve selected the custodian of your future based on their Excel skills, you’re in trouble. (Excel skills are great for manipulating numbers that others input and influence, but not for determining key numbers based on future business events.)
And the very first mistake that most businesses make in forecasting is that the CEO assumes it’s solely about numbers and jumps into the numbers too quickly. Isn’t this why so many mid-market companies give up on forecasting altogether? When it’s never accurate, why waste the time?
As you’re reflecting on 2016 and thinking about changes you’ll make in 2017, consider revising your forecasting process. Here’s what I recommend to my Vistage groups and clients:
- Determine your core forecasting team – the people with the pulse of the future of the business
- Follow this monthly forecasting process
- Use SON communication to eliminate SILO mentality
- Work with your CFO or controller to input the numerical results into a 24 month rolling model
I’ve seen this process transform many CEOs’ ability to successfully predict the future of their businesses.
Merry Christmas!
Creating a Culture of Accountability

If I were to ask you the following question, what would your response be?
When something goes wrong in business, does it typically result from poor strategy or poor execution?
From my experience, there’s a ten to one ratio between these two.
And as you probably already know, the answer is poor execution. It’s a serious issue with many companies, so much so that there’s a saying that poor execution eats strategy for lunch; it doesn’t matter how great your strategy is, if your team doesn’t execute, then it all falls apart.
So why is it so common that execution is inevitably compromised?
It’s compromised when you fail to have two things:
- Accountability
- Responsibility
Establishing Accountability
In every turnaround consulting project that I performed earlier in my career, the first thing I focused on was instilling a culture of accountability. Without it, the turnaround was doomed.
As a turn-around consultant, I had a license to change things. Moreover, I had a responsibility to change things. Without change, the company would go broke. So people listened.
To begin creating the culture, I implemented what I call Integrated 3W Accountability. It’s a concept so simple that on the surface, many of you will dismiss it, or worse, you will think that you are currently doing it. And you may well be, but the vast majority of businesses that I have worked with are not.
Integrated 3W Accountability is the concept that every action has to have a what, a who and a when. That’s it.
Not very complicated, right?
As with many of the concepts I’ve implemented, it is not how simple it is, it’s how effectively you implement it.
Creating the Culture
The first action I would take was to bring together the leadership team for an open planning session. I’d kick off the session with a conversation about the positive – what are the things that we do well? What have we got here that’s worth saving? Then I would recognize that there were some things that were not done well, otherwise, we wouldn’t be in this position. But my focus now is about how we could do those things better in the future. It was important that we kept the conversation positive, even when we were talking about business weaknesses.
At the end of that conversation, the walls were always covered with flip-chart paper filled with a surprising number of great ideas!
After the meeting, I introduced the Integrated 3W Accountability concept. It’s easy to explain, but also very easy to fail to execute. Why is that?
- Some people will sandbag
- Some people will say that they’re too busy
Here’s the process I used to prevent this from happening:
- Have the team select five ‘whats’ that are going to be easy for people to commit to.
- Allow each person to define the when. This is important – allow them to own it! Do not override it unless there are extremely unusual circumstances.
- Clearly establish the non-negotiable rule that one of two things must happen by the when: Firstly, and preferably, you complete the action. If for some reason you cannot complete the action by the deadline, contact me beforehand and request an extension. What is not accepted is to sail through the deadline because you are too busy.
- Strictly enforce rule #3!
There will always be some people who will think that the rules don’t apply to them and will allow the deadline pass without completing the task or requesting an extension. Hold them accountable or let them go.
If you do not, the whole thing falls apart.
Enforcing rule #3 is the key. Do this, and you will begin to create the foundation for a “Culture of Accountability.”
Forecasting Fallacy – It’s Not About the Numbers

Financial forecasting is a standard activity at the enterprise level. Big companies create detailed monthly and quarterly projections including revenue, expenses and net profit. Public markets demand it.
So why do so few mid-market executive teams commit to an effective forecasting process? And I’m not talking about the standard back-of-the-napkin annual revenue and profit estimates that take about 5 minutes to create; I’m talking about engaging in the legitimate business process of projecting the numerical values of the business on a monthly basis for the next 12 months into the future.
Here are some of the most common excuses I hear:
- I can’t predict the future
- My accounting system won’t handle this
- Things change too quickly
- We used to forecast, but our forecasts were never accurate
- Our data isn’t ready by month-end
- We don’t have the bandwidth
- Our accountant handles the numbers
- I’m not the numbers person
The last two irk me the most. After working with over 1,000 businesses across the world over the past 15 years, I can unequivocally say this:
If you don’t understand your numbers, then you don’t understand your business.
It’s that simple.
Yet I’m consistently shocked at the sheer number of mid-market companies that fail to engage in an acceptable monthly forecasting process.

That’s one of my favorite Churchill quotes, referring to armies, battle and nations. And it’s just as relevant for businesses.
The problem I see with many businesses is that their leadership team thinks that planning is talking about taking a number that’s hard to understand and potentially irrelevant and placing in a graph or chart and voila – forecasting is done!
That’s not enough.
In my 12 years of speaking with Vistage and TEC groups through the world, I’ve had the unfortunate experience of seeing a handful of businesses fail when some of these failures could have been prevented by using an acceptable forecasting process.
But I’ve also had the good fortune of having some CEOs tell me, “Nick, we would have gone out of business if we weren’t using the 12-month rolling forecasting procedure you recommended to prevent a catastrophe.”
That’s rewarding.
But forecasting is difficult for most businesses, and the #1 mistake that businesses make (aside from NOT forecasting) is this:
When implementing a forecasting process, they jump into the numbers too quickly
How is that a problem? Isn’t forecasting about numbers?
Effective forecasting is about the process of discussing the following:
- How the business landscape has changed over the last 30 days
- How that will affect your business
- How your numbers are affected by #2
A few numbers dropped into a spreadsheet on a whim is not an effective forecasting process, but having the above discussions with your core leadership team, on a monthly basis, can be. I call this process SON communication.
The real key to financial forecasting is your monthly communication process. Fix this, and you’ll get incredible value from the process.
SON Communication – A Process That Eliminates Silo Mentality
Every month I get to travel to different parts of the world to talk about a subject I am passionate about: creating value in business.
There are only two things that matter in businesses for creating value – people and cash flow.
Everything else is secondary.
Without a shadow of doubt, the most common mistake that I see in business (that destroys value and compromises so much potential) is silo mentality. You know what I’m talking about, don’t you? The attitude of not sharing information and building barriers to protect your turf?
Silo mentality destroys value in your business. When your people aren’t communicating effectively, your business is failing at one of the most important drivers of value.
Managers and executives commonly create complexity in their business. It’s natural for many. Yet simplicity is what they should be striving for. I talked about that in my last post.
So how do we remove it?
After working with over 1,000 businesses across the globe, I’ve developed a practical process that can eliminate silo mentality.
It’s called SON communication.
SON communication is a process that costs you nothing, but if you do it effectively, you’re instantly going to increase value in your business.
How SON Communication Eliminates Silo Mentality
SON communication is a process to drive a monthly conversation amongst management teams to get them to raise their horizon and address each business issue in strategic first, operations second and numerical third.
It’s about having each and every member of the leadership team participating, understanding and contributing to all three “circles.”
With SON communication, it is not acceptable for anybody on the leadership teams to err in one of those three values. The CFO can’t only focus on numbers. The creative people can’t delegate the numbers conversation to the CFO. (If you don’t understand your numbers then you don’t understand your business.)
You need to be able to engender that conversation amongst the leadership team. And you need to do it in a manner that contributes to the views, in other words, you need to be able to disagree but without being disagreeable.
The most robust leadership conversations that you could have are the ones where you have a variety of opinions, because quite frankly if you want to agree, there is no point in having more than one person in the room. So I want leaders to take different views, but I want them do it in a manner that they are not going to end up punching each other.
This helps to break down the silos in your business. When everybody is trying to make themselves look intelligent, you’ve got fences and silos.
SON communication pushes the circles together.
Now, it’s important to understand you never want the circles to totally overlap. You need these experts in the leadership team to be experts in the field, that’s why they are there. But you also need them to able to talk to each other, so you need a common ground.
With that said, the most frustrating hybrid is the operations and numerical, because not only are these two different languages, but they are now competing to get the attention of the CEO from very different angles. But I never wanted a bilingual, I wanted all three. I want each and every member of the leadership team to participate, understand and contribute to strategic, operational and numerical. That’s what SON communication is.
Selecting Your SON Communication Team
If you have someone in your leadership team who is saying, “I don’t know, I don’t have a crystal ball,” or “these things changed too quickly, I can’t tell,” then that person doesn’t belong on the leadership team.
That person might be an astonishingly effective “today operator,” so let them go and manage “today.” And if that means that your leadership team shrinks to 2 or 3 people for SON communication, that’s fine! So long as these 2 to 3 people are talking to the others before they come to the table to collect information that they might find interesting about tomorrow.
So take the opportunity to go back and challenge whether your leadership team is actually a leadership team, or whether they are just “today operators.” It might influence how effectively you have these conversations in future.
Your best determinant of whether you have silo mentality in your business if is you hear, “It’s complicated, you won’t understand.”
I’ll end with one of my favorite quotes from Albert Einstein:
If you can’t explain it to me simply, you don’t understand.
The Simple Way to Improve Your Business
Good executives and managers are always looking for ways to improve their business and there are plenty of consultants around the world trying to help them.
These consultants invest in training programs, education, research, case studies and in creating their own intellectual property.
You’re probably familiar with many of the ridiculous management fads over the past few decades: six sigma, business process reengineering, matrix management, management by consensus, core competency… and so forth.
These techniques were all developed by intelligent people and implemented by top-level leaders of very successful businesses. On the surface, they should have worked, right? But did they? Often, the companies that implemented these ideas lost value. And (other than the most obvious reason of sucking the productivity out of their workers) there is one common reason.
Complexity.
Each of these ideas added layers of complexity into the business. Consultants and managers created entire new languages that few in the business understood. Precious time was spent on learning how to add complication to the business, instead of simplifying the business.
I first experienced this at age 25 when I was dropped in the deep end and tasked with running a branch of a software company. It was terrifying; every single person that worked for me was older than me, I’d never run a company and I knew nothing about software.
Have you ever noticed what’s unusual about the IT industry?
The vast majority of information that comes out of an IT person’s mouth makes no sense to the rest of the world. They speak in absurd babble and jargon – it’s an industry that’s riddled with TLAs and EFLAs .
TLAs – Three Letter Acronyms
EFLAs – Extended Four Letter Acronyms
Nobody else in the company spoke this language. So I introduced a rule on day one which was critical and possibly the luckiest and smartest thing I have ever done in my career:
The “plain English” rule.
If you wanted to bring an issue to the leadership table, you had to bring it in plain English. You couldn’t bring it in jargon, because quite frankly I had no idea what you were talking about. Also, what I learned very quickly was that it wasn’t just me that didn’t understand; members of my team didn’t always understand each other either.
Complexity creates confusion and silos. It saps productivity.
Simplicity creates understanding and collaboration. It improves productivity.
Plain English communication has now become a central tenet of RealTimeCEO.
Eliminate the jargon in your business and use “plain English” and you’ll be amazed at the results. It’s that simple.

(The cartoon is courtesy of the Plain English Foundation. They provide training and workshops for businesses in Australia for simplifying corporate communications.)
Something New is Coming…
In our last post, we discussed the mechanics of 24 month rolling forecasts. (Ok, we realize that was over a year ago.)
Wait…
Did you think we’d just let that one slide?
The past 12 months have been incredibly busy for us. In addition to our continually expanding client base and Nick’s RealTime CEO workshops throughout the year in the US, Australia and the UK, we’ve been undertaking quite a large project since the end of 2014
What is it? While we’ve been keeping it under wraps during development, we decided to give you a hint since we expect to reveal it soon. In the near future, we’ll be working with select Vistage Chairs, CEO group leaders and CEOs/CFOs to complete the final testing of our new financial modeling software.
Instead of being local software similar to our current and previous versions, our new app will be delivered via software-as-a-service (SaaS). It’s designed for large groups of users to apply the RealTime CEO principles to their existing financial statements, including 24 Month Rolling Forecasting and our Crystal Ball, on their own, in real time.
This won’t fully replace our existing software which we customize for our current client base; it will provide the core features and functionality in the SaaS format to allow more companies to apply the powerful concepts and financial tools to their business. We expect it to be a key driver of our future growth and to allow us to make an impact with businesses anywhere in the world (instead of just with existing client relationships with companies in the US, Canada, Australia and the U.K.).

It’s been quite an undertaking. We’re excited that the journey is nearing completion and we expect to be actively blogging again soon and engaging with our users online.
We’re currently staging the final testing along with a carefully-controlled CEO group rollout, but if you’d like to be involved before we reach out to you, connect with us to request early access.
Cheers,
Nick and the RealTime CEO team
Mechanics of RealTime 24 Month Rolling Forecasts
In our last blog, Forecasting the Future – Alternatives, we discussed the benefits of RealTime 24 Month Rolling forecasts. In this blog, we’ll give you more information about how RealTime 24 Month Rolling works.
The 24 Month view includes the actual figures for the past twelve months and the forecast figures for the next twelve months. For example if the current month is August 2013, we have twelve months of actual figures back to September 2012 and twelve months of projected figures to July 2014. As each month ends, you replace the projected figures for that month with actual ones. At the end of August, replace the August projected figures with the actual ones, drop off September 2013 and add August 2015 with the forecast figures for that month. This way, you’re always looking twelve months ahead.
Here’s an example –

Mechanics of 24 Month Rolling
Our forecasts provide the basis for a monthly conversation about the strategic, then the operational, then finally the numerical business landscape. It’s so easy to focus on the numbers but it’s really important to cover the strategic and operational issues before the numbers. Consider the journey before jumping straight to the solution. You can guide the conversation by asking three questions:
1. What information has come to light in the last 30 days that changes our view of the future?
Some of the issues to consider for this question are:
- What is our proposed market strategy going forward?
- Are we opening up new markets?
- Are there new competitors in the market?
- Are we launching new products or services?
- Is our product/service mix changing?
- Have projects slipped back or come forward?
- What is happening in our supply chain – availability/ reliability/ price?
2. How will we change our behaviour?
3. What will be the numerical implementation of these changes?
As we illustrated in our Sensitivity Analysis, you can use the eight Fiscal Focus levers to determine the impact that small changes in the levers will have on the overall health of your business. The sensitivity analysis tells us which levers have the most dramatic impact and which have the least impact. So it makes sense to have a forecast that puts the most important levers first, to drive the conversation towards the more relevant topics.
When we forecast, what sort of model should we use? There’s the aspiration model, which is what you want to achieve or there’s the reality model, which is what you know you can achieve with the resources you have. The difference depends on which category your revenue belongs to. You can use the marriage/engagement/dating analogy to assess your revenue certainty levels. Marriage revenue – you have a contract or you are absolutely certain of getting the revenue. “Engagement” revenue – also known as pipeline; you can list the amounts but you’re not certain. “Dating” revenue – you can’t list the details and you have no certainty of getting it. The “engagement” and “dating” revenue becomes your sales risk profile.
For more information about how RealTime 24 Month Rolling can benefit your business, contact us. We’d love to help your business.
Forecasting the Future – Alternatives
Forecasting the future relies on an accurate method of measuring past and current performance. As the year progresses, everything is compared back to the figures provided at the beginning of the year. Many businesses operate this way mainly because that’s the way they’ve always done it. This limits your view to the number of months that have passed since the start of the year and may cause trends to be missed. The YTD method does have value when you need to estimate tax but leave that to the accountants; RealTime CEOs need a more effective method of forecasting everything else.
What if you could always have a complete set of data for twelve months or twenty-four months, no matter what time of the year it is? In our blog 24 Month Rolling Forecasts, we discussed the Trailing Twelve Month method of measuring your business’s performance. This method gives a twelve-month view of your business at any given time. As one month drops off, another month adds on. But what if we could look even further ahead?
Imagine you’re driving along the freeway in a shiny, new sports car… Research tells us that we maintain a field of vision of about 120 metres in front of us. What happens in that field of vision helps you make decisions while driving your car. Now, we don’t just keep looking ahead to the same spot, otherwise we’d end up looking at the front of our car, which would be really dangerous. Instead we keep looking ahead in that field of vision. This is what we want to do when we measure business performance. When you look ahead to the end of the year, the distance is shrinking as you get closer to it. What we want to do is maintain your field of vision ahead of your business.
We can better accomplish this with RealTime 24-Month Rolling Forecasts. In our next blog, we’ll examine the mechanics of RealTime 24-Month Rolling forecast. You can also contact us for a plan that’s tailored to your business.
Core Management Principle 5 – RealTime Planning
“He who fails to plan, is planning to fail.” – Winston Churchill.
Winston Churchill was referring to armies, battles and empires when he said this but it’s equally relevant for businesses.
Businesses need to forecast in order to plan but the forecast process for many businesses is weak and unreliable. They use historical data to analyse the past then work out the future later. But it’s not just about forecasting, we want to create a management culture that improves a number of different areas in your business by providing:
- Strategic conversations – we need a forum for strategic conversations across the management team
- Instant & valuable management reporting – the traditional accounting process is too slow at getting the next lot of figures out and is difficult for executives to understand.
- Better sales management mechanism – managing a significant sales team is complicated and anything that helps improve that process is worthwhile.
- Better forecasting – Better forecasting is essential for predicting and influencing the future. In fact, if you improve in the first three areas, it will help to improve your forecasting anyway.
For many businesses the traditional budgeting process is a long and frustrating one. It is driven by the CFO and is only completed once each year, which doesn’t allow for changes in the landscape. The process is based on the income statement, which is not always understood by those who receive the budgets.
In RealTime Planning we ask the following questions:
Q. Who in your business is best qualified to predict and influence the future?
A. The CEO, followed by sales people and operational teams.
Q. How often is the landscape ahead of your business changing?
A. Often enough that you need to measure each month, rather than annually.
Q. Is there a better way to measure the past?
A. Trailing 12-Month or RealTime 24-Month Rolling
Q. Is there a better way to plan & forecast the future?
A. RealTime 24-Month Rolling
For more information take a look at our blog, 24-Month Rolling Forecasts or contact us for more information and assistance.
You can also follow us on Facebook and Twitter.
J Curves – Other Considerations
Welcome back to RealTimeCEO. In our series of blogs on J Curves, we’ve discussed J Curve Management, the Three Phases, and the 5 Management Rules. But there are some other issues to be aware of with J curves that we will cover here.
First of all it’s important to remember that questioning a J curve today doesn’t necessarily mean you are questioning the original decision. If it’s to find a scapegoat you can shout at, it’s going to be a waste of time. Revisiting the original decision is far more productive if you do it as a learning exercise to improve your future performance. It’s quite possible that it was the right decision yesterday to make the J curve investment. But it’s also possible that it’s the right decision today to get out of it because the landscape has changed. So the key issue is to look at your landscape today to determine whether the investment is still going to deliver value and make decisions with that in mind.
Is it possible to slip backwards on a J curve? Yes, it is; these are called W curves. They progress from phase one to phase two but then fall back again. W curves need to be managed as you would manage any other J curve in phase one.
Can a J curve be macro and micro? Yes, executives at different levels through the business can manage J curves. The CEO is responsible for the company-wide macro register, containing investments that will have a profound impact on the business. But we also encourage the establishment of divisional J curves, overseen by divisional managers, for micro investments.
Costs of J Curves
There are two costs associated with J Curves. The first cost is pretty obvious. If they are managed badly you will lose cash flow, return and profit.
The second cost, executive headspace, is less obvious. If you ask your executives to juggle too many at one, some or all of those J curves will hit the ground. Your executives will create more value for your business if they do a fewer number of things well, rather than a number of things badly.
“A weak strategy well executed will inevitably outperform a strong strategy poorly executed”
Nick Setchell
The impact of J Curves
The impact of J curves can be broad. Obviously J curves can impact positively or negatively across your business. If you implement a J curve well, you will build cash reserves and all the benefits associated with that. It will have a positive impact on your business. On the other hand, if you implement or manage J curves poorly you’re likely to lose potential and never get the full reward for your entrepreneurial flair. Things will fall through the cracks. If you implement or manage J curves really badly, you are in real danger of bankruptcy. Review your J curve register regularly to make sure this doesn’t happen to your business.
The Cost and Impact of J Curves
The identification, prioritisation and management of J curves is the single most important determinant of entrepreneurial success. Would you like to manage your J curves better? Contact us; we’d love to hear from you.
J Curves – 5 Management Rules of J Curves
J Curve investments are a strategic decision to spend money today to receive a benefit tomorrow (in the future). We make these investments because we realise that the short-term financial loss is offset by the benefit it brings to your business in the medium to long term. Here at RealTimeCEO we believe in the importance of managing your investments well. To help your business do this we created a framework that we discussed in our last blog, J Curves – 3 Phases. Part of that framework is our list of 5 Management Rules of J Curves.
As the CEO, your role is to manage the macro j curves, investments that have a major impact on the overall business. As we noted in our blog, The Perfect Skill Mix of a CEO (insert link), the two main components of the CEO’s role are to create value and to mitigate risk.
Here are our 5 tips for managing J curves effectively:
1. Minimise the depth and breadth of the valley.
As we illustrated in J Curves – 3 Phases, the valley is the time between your initial outlay and when the project starts making money. It will inevitably end up being deeper and wider than you imagined at the start of the project. This rule is important for mitigating risk. We want our executives to come to us with innovative ideas. The executives naturally want the CEO to adopt their ideas and will place more emphasis on the upside of a project in order to sell the idea. As the CEO you need to be able to assess the costs as well as the benefits and do everything in your power to limit the size of the valley. Twice as long and twice as wide as you originally thought – keep that in mind.

Manage and attempt to limit the depth and breadth of the valley
2. Don’t become emotionally involved.
One of the toughest things about being a CEO is not becoming emotionally connected to your investments. CEOs must have passion and enthusiasm but they also need to understand the implications of each of their decisions. If you hear yourself, or one of your executives referring to it as a pet project, be wary; that’s a classic indicator of an emotional connection to the project. And there’s another part of our business that is filled with emotion – our people. Have you ever hired someone who had a fantastic resume and interviewed really well, only to realise they’re not adding value to your business? This employee could in fact be sucking resources out of your business and become a “flat liner”, continuing to draw the same amount of resources or even worse, a “ski slope” type of J curve that starts to suck even more out of your business. Once a large amount of money has been spent on an investment, it can be hard to let go. But if the investment is a ski slope, you need to recognise that fact and get out of it before you waste any more money on it.

Do not become emotinoally connected to the J Curve
3. Don’t take on too many J curves at once.
While J curves are in phase one, they are sucking resources out of your business. No matter how many brilliant ideas you and your executives have, it makes no difference if the drain on your resources is going to send you broke. When you’re preparing to embark on a new J curve, ask yourself the following questions:
- · Is the investment strategically beneficial to your business?
- · Is now the right time?
And don’t worry about your executives getting offended if you say no. Just be sure to communicate to them that the time just isn’t right for their idea.

Do not take on too many macro J Curves at once
4. Have and manage a plan to move from phase one to phase three as quickly as possible.
Have a plan that enables you to move the J curve from phase one, through phase two and finally to phase three. There are different resources required for the three phases of the J curve. The people required for the investment and the catch up phase are the innovators, people who conceive the ideas and are able to promote them. But you need a different set of skills to drag the project from the bottom of the valley to the blue sky. These people are implementers. Ideally these roles should overlap and they can do this successfully if the issues have been effectively documented, communicated and procedures for them have been written. Be careful of innovators who are reluctant to let go of their “baby” or are ready to drop their J curve while it’s still progressing, in favour of the next big thing.

Have and manage a plan to move from phase 1 to phase 3 as quickly as possible
5. Establish a J Curve register.
Create a list of all the J curves you currently have, with documented updates on their progress. Excel is handy for this but you can do it elsewhere if you prefer. Your J curve register should include the following:
· What the J curve is
· When it started
· The progress on this J curve
· Money in
· Money out
· The net position of the J curve
· 3W action management (insert link)
One of the things we commit to with a J Curve register is to review and update the register regularly, at least once a month. Put it on your agenda for monthly management meetings and discuss each J curve. This will help you identify any issues, such as:
Do we have too many J curves on our register?
Have any of our J curves stalled?
Are any of your J curves turning into ski slopes?
Can we help you with managing J curves in your business? Contact us at RealTimeCEO for some specialist advice.
J Curves – 3 Phases of J Curve Management
In our previous blog J Curve Management, we discussed how important it is to your business to manage J curves well. On your journey through time you look out over the horizon and you come up with an idea that you know is going to make your business stronger in the future. But you also understand that to implement and get value out of that idea, you need to take a step back before you can take any steps forwards.

The 3 Phases of a J Curve
This diagram shows why it’s called a J curve. The black curve represents the investment; it sucks the cash out of your business for an amount of time we call the risk zone, before coming back up to its starting point and eventually surpassing it. The diagram also shows you the three phases in the life of a J curve:
J Curve Phase 1, the Investment phase –
This phase starts at the beginning of the project and ends at the bottom of the valley. This phase has two main characteristics. Most investors understand the first one because it’s the most painful. This is where you write out the significant cheque to make the investment. The second characteristic is sometimes hidden and often ignored. But ignoring this issue can be dangerous. We call it cash flow bleeding when, even after you’ve paid the initial investment amount, the project is losing more money than it is making. This causes a drain on your cash flow. At some point the money coming in will equal the money going out. This point starts at the bottom of the valley and marks the transition to Phase 2.
J Curve Phase 2, the Catch Up phase –
In phase 2, the project is still cash flow negative over the life of the project but it’s beginning to catch up. It’s now bringing in more money than it’s paying out. Our ultimate objective is for the project to reach a point where you’ve made more money over the life of the investment than you have paid out. This point brings us to Phase 3.
J Curve Phase 3, the Blue Sky phase –
When your project has delivered more to your business than it has cost, you have achieved the future benefit you originally invested for. You have become stronger today than you were yesterday as a result of that j curve investment.
The yellow arrow represents a calculation done by many businesses, which is to assess the length of time it will take before you are paid back for the amount invested. But there is much more to the investment than a single payback timeframe. It’s more important to understand how much cash is going to be sucked out of your business by this investment. This is why we refer to it as the risk zone. There are lots of things that can happen in your business while your J curve is in the risk zone. Any number of these can cause the project to stall, leaving you with nothing but wasted time and money.
Don’t let your J curves stall. Contact us to find out how we can help you manage your J curves to create the most value for your business.
J Curve Management Framework
In a previous blog, What are J Curve Investments?, we introduced the concept of a strategic decision to spend money today in order to gain a benefit in the future. In today’s blog we discuss how we can manage J Curves to drive business growth.
So, why do you need to manage J Curves?
J Curves for midmarket companies (larger than $1m and smaller than $100m) are broadly defined as any decision to spend money today where the benefit will not accrue until tomorrow or the future. You recognize that the short-term financial loss from these strategic investments is offset by the medium to long-term benefits to your business. At RealTimeCEO, we’ve analysed and worked with over a thousand businesses around the world and every single business in every single industry has J Curves in it. This makes the management of J Curves absolutely critical.
“The identification, prioritisation and management of J curves is the single most important determinant of entrepreneurial success.”
– Nick Setchell
Some J Curves that you need to identify in your business could be decisions such as:
- new product line
- new access to market strategy
- new equipment purchase
- new staff hire
- new business premises / opening other premises
- moving manufacturing overseas
- acquiring competitors.
We have designed a framework to help CEOs identify, prioritise and manage their J Curves. This framework is made up of:
- Three phases of a J Curve
- Measurement of J Curves
- 5 Rules for management of J Curves
- Other issues to consider
- Broad impact of J Curves
Stay tuned for our next three blogs where we provide more details on each of these aspects of the framework. Or for a personalised plan tailored to your business, contact us. We’d love to hear from you.
Mathematics of Pricing – The Impact of Price Increase or Price Discount
What would be the impact of price increase or price discount on your business? In this blog we’re going to look at your pricing strategy.
A lot of people tell me their businesses don’t set their own pricing; the market does that for them. This is not true in most cases. It is true to say that there are a small percentage of businesses that don’t have any control over their pricing. If you’re selling a product that is regulated by law, you have no control. If you’re selling homogenous commodities like gasoline/milk/wool, the world markets will set the price. Sometimes you may be selling to an 800-pound gorilla. Do you know where an 800-pound gorilla sits in the room? The answer is anywhere it wants to. If you’re selling to an 800-pound gorilla you get told what the price is, take it or leave it. But for the other 99 percent of businesses, you have control over your pricing.
Your contribution margin is how much of each dollar of sales is remaining after all variable costs are covered. It called a contribution margin because it is the component of the sales dollars that contributes to covering fixed costs and profit.
For example, if your contribution margin is 30% and you increase your price by 10%, if you lose exactly 25% of your volume margin you will generate exactly the same contribution margin in dollars. However if you discount your price by 10% you will need to increase your volume by 50% to generate the same contribution margin in dollars.
The Impact of Price Increase
After a Price Increase, what percentage drop in unit sales will result in the same $ Contribution Margin?

The impact of a Price Increase
The Impact of Price Discount
After a Price Decrease, what percentage increase in unit sales will be necessary to result in the same $ Contribution Margin?

The Impact of a Price Discount
As you can see from this example, you need a bigger change in volume following a price discount. You have to work so much harder to catch up after a price decrease that it’s not worthwhile for the amount of return.
In our experience a price increase will benefit the business whereas a price discount will not. This is the opposite of conventional sales wisdom. The sales people are likely to be the ones in your business most vocally opposed to a price increase, in particular, your weakest sales people. Here’s a piece of advice –
“Don’t set your business strategies based on feedback from your weakest staff members.” – Nick Setchell.
If you want any more information on this or any of our other tools, just contact us!
Sensitivity Analysis
Sensitivity Analysis helps you decide which action will have the biggest impact on your business
In our blog 3W Accountability we discussed how we hold people accountable for actions being completed. It’s all very well to decide what action you’re going to take but how do you ensure that you’re allocating your scarce resources in the most effective way? In this blog, we’re going to look at sensitivity analysis as a way of helping you decide which action will have the biggest impact. Sensitivity analysis enables you to determine which one percent change to any of those levers will have the most profound impact on the business’s strengths and weaknesses.

– Sensitivity analysis calculates the impact of changes to each RealTime lever
– Highlights areas of high impact – inevitably price
– Also highlights areas of low impact – inevitably variable indirect costs.
In the diagram above we demonstrate how a one percent change to each of eight Fiscal Focus levers will impact your profit. Fiscal Focus levers are things that executives can change in order to influence the performance of the business. As you can see, the lever that has the biggest impact is price. But it’s interesting to note that variable indirect costs has a lower impact than many other levers, something to think about if cost-cutting is one of your main strategies.
Sensitivity analysis shows you how to allocate your resources
Sensitivity analysis shows you how to allocate your scarce resources to where they’re going to have the biggest impact. An analysis of your business will clearly show what is most effective at creating value and improving your performance. How much easier would it be to make business decisions if you knew how effective the changes would be before you made the decision?
Contact us on how to get specific information on a sensitivity analysis for your business.
Join us again next time as we look at the Mathematics of Pricing. (This one may surprise you! 😯 )
Core Management Principle 1 – 3W Accountability
Welcome to our series of blogs looking at the Core Management Principles. The first of which covers what I call 3W Accountability
“The price of greatness is responsibility”
– Winston Churchill.
I like this quote, not because of the words that are in it but because of the words that are not in it. Churchill did not say the price of greatness is intellect or hard work or turning up to work on time or being a nice guy. It’s about taking responsibility. When I was 25 years old I was asked to take over and turn around a software company that was doing badly. I was terrified. Nearly everybody in the company was older than I was. My first major action was to gather all the key executives together. These days we would call it a “strategic planning” session. But back then I just called it a “what the hell am I going to do?” session.
I found the executives had plenty of knowledge in their own areas and we came up with some excellent ideas that we made into a plan. We needed to formulate those ideas into actions and everyone needed to play their part.
How do we make people accountable?
The answer is by using a process that is very simple. It’s called the 3 Ws. Each time you define an action, attach the 3 Ws to it – What, Who and When. Pretty simple, isn’t it? What is the action? Who is responsible for completing that action? When will the action be completed? The group defines the What and the Who and the Who defines the When. You as the CEO set an expectation that one of two things will happen by the When. One, the action will be complete; or two, if the person cannot complete the action by the deadline, they come back to group and ask for an extension, prior to the deadline.
So, we come back together for the next meeting and go through the actions we agreed on last time. Most people have completed their actions. But one person hasn’t. What happens next is critical. I stop the meeting. I say in a quiet but firm voice, “That is not an acceptable answer. That answer has disrespected this group. We made an agreement a week ago that one of two things was going to happen by the When. It’s not acceptable.” Suddenly the room is deathly silent. Everyone will anxious to complete action items next time. And you can be sure that ten minutes before your next meeting you’ll have a flood of people coming to your office and asking for an extension.
And that’s ok. Because what you’ve now learnt is who in your business is overwhelmed, who in your business is not able to meet deadlines, who in your business is taking you for a ride, and those who are the valid contributors in your business who will help dig us out of this hole. And believe me, those things are really handy to know. I did turn that company around and I’ve used the 3Ws technique for every turnaround that I’ve done since. It works.
Now that you have got your people to be accountable, how about knowing which of the actions will have the most impact on your business. Come back next time to find out when we look at Sensitivity Analysis.
The next in the series of Core Management Principles looks at an introduction to Fiscal Focus.
Want to know more about the 3Ws or any of our other tools, just contact us – it’s easy!
The 4 Business Quadrants – Your Operations
Your operations are the engine of your business.
This includes equipment, systems, procedures and supplies. All of these enable your business to produce its product or service.
The next two years will bring rapid change, which creates opportunity and potential growth. Traveling around the US, we consistently hear growth forecasts of up to thirty percent in the next twelve months. How exciting! But consider this question first – how well equipped is your business engine to seize these opportunities?
When the financial crisis happened, the operations of businesses changed. The first indicator was the increase in the number of days for Accounts Receivable. It was an early warning sign of tough times ahead. Next, there were pricing pressures, initially called downsizing, later changed to rightsizing as the operations became leaner. The engine you now find has lean capacity, tight pricing and with Accounts Receivable higher than they should be. And this is the engine you’re going to ask to grow by thirty percent?
“Now, let me introduce another concept, the second wave of bankruptcy.
It’s a sad fact that many businesses went under during the financial crisis. As sad as that is, maybe it needed to happen. The poor performers are weeded out and the strong ones remain to grab the opportunities in the improving economy. But not all businesses that survived the first wave of bankruptcy will survive the next two years.” – Nick Setchell
Consider the capacity of your engine when making your growth forecasts. It’s much better to grow by twelve to fifteen percent with a sensible pricing strategy, than by thirty to forty percent with a foolish pricing strategy. A business with the latter is a candidate for bankruptcy. It’s going to happen to many businesses, so be sure it doesn’t happen to yours.
‘Your Operations’ is the final of the 4 Business Quadrants. Feel free to go back and read about the other quadrants – Your Foundation, Your Market and Your People
Join us for our next series of blogs on Core Management Principles. The first one will look at what I call ‘3W Accountability’. If you want to more, contact us to have a chat with Nick Setchell.
Celebration Culture
Welcome back to our readers! In our last blog Your People, we discussed the important role your staff play in your business. Today we will be looking at ways to boost morale among your staff by creating a celebration culture.

Create a Celebration Culture in your business
Why have a Celebration Culture
It’s important to celebrate regularly in your business. People respond well to positive stimulation. But when times are tough, it’s easy to get caught up in negativity and forget about celebrations. This mood filters through to all your people.
“But the tougher it gets out there, the more you have an opportunity to win. Let’s turn around that negative outlook and think about what we have to celebrate. What are we doing well? What are we proud of? What about the fact that we’re still here? You know who isn’t celebrating that? The people who are no longer in business. Well, we’re here and that’s worth celebrating.” – Nick Setchell
How to create a Celebration Culture
Find something you can celebrate each week. If someone wins an award or delivers an outstanding customer experience, there’s a great reason to call it out and generate pride in the business. Celebrations don’t have to be expensive or on a large scale. Ideas can include recognizing achievements in meetings, providing morning tea, issuing small mementos such as pens or coffee mugs with positive messages or hosting a lunchtime/after work BBQ. Not only does this give your people an opportunity to gather in a more relaxed setting, it gives you as the CEO an opportunity to tell your people in person what a good job they’re doing.
If you’re the type of boss who doesn’t often praise your people for their achievements, creating reasons to celebrate will have a powerful positive effect on morale. And if you’re the type who constantly hammers your people to do better, it can have an even greater impact. If you just push your staff all the time, they will get used to it and will just stop listening. So it’s important to keep the right balance of encouraging your people to do better and celebrating their achievements.
Come back and join us for our next blog where we will be focusing on Your Operations and how well equipped your business engine is to seize growth opportunities.
Want to hear more about RealTime CEO and how it can help your business? Get in touch with us and organise a chat with Nick Setchell.
The 4 Business Quadrants – Your People
Your people are the people who work in your business. Their input allows your business to produce its product or service. ‘Your People’ is also the 3rd quadrant in the 4 Business Quadrants.
How do you know what kind of people you have working for your business? Do you have validated way of assessing whether your people are doing what you’ve asked them to do? I’m sure each of you has uttered those immortal words, “People are our greatest asset.” You may be right. If you are, then one of the most critical parts of your job, whether you like it or not, is to be a part time psychologist for your people. CEOs have many qualifications but a degree in psychology isn’t usually one of them. Most CEOs are not qualified to do one of the most important parts of their job. So, how do we manage the different skills and challenges of our staff members? The good news is that people assessment tools are more powerful and more readily available today.
How do we communicate with people in other areas of the business? People come together from different areas of the business but everyone has different skills & different areas or expertise. It helps if we can create a common vocabulary that enables everyone to participate. For example – in terms of plain English measurement of business performance, check out our blog on Fiscal Focus.
Unlike other business assets, it’s much harder to predict what is going to happen with people because human beings have free will and different people will respond to different management styles. Try to establish what makes your people tick and think about how you could vary your management style to get the best out of your people.
If people are our greatest asset then it’s important to keep them people happy. And it’s especially vital during tough times. In our next blog we will discuss Celebration Culture and how you can improve morale in your business.
Think you need some more advice in this area? Reach out to us and we can help you.
Dominant Competitive Advantage (DCA)
What is DCA
Those of our readers with sales experience will know about unique selling propositions (USP). They are the reason that one product or service is different from and better than that of the competition. Dominant Competitive Advantage (DCA) is to the whole of business what a USP is to a product or service. What is it about your business that is superior to your competition? Why should a potential customer deal with you above any other business?
Most midmarket companies don’t have a DCA. It’s surprising that when we ask this question more than fifty percent of the respondents think their DCA is customer service. This sounds good until we test it through the most stringent filter – is this something YOU can say that your competitors cannot? Are your competitors saying they provide good service? Probably! Whether they are or not is not really important – if you keep pushing your case on “customer service” your prospect will not be able to distinguish you from everyone else saying the same thing and then you will be forced to compete on price . Very few businesses want to end up here – only the biggest, deepest pocket player in the market will win this battle.
Does your DCA pass the test?
Your DCA is a powerful simple reason why your prospect should deal with you and not your competitor. Yes it is a strength of yours but it is more than that. Good DCA also pass these tests:
- Focused and simple
- Objective
- Quantifiable
- Self-centered
- Supported by stories
- And most importantly, not stated by competitors
Once you’ve found your DCA, build your business communications around that distinguishing factor. Every component of your communications should relate back to your DCA. Your website, advertising, proposals, bids, elevator speech and anything else that represents your business should all emphasise what makes YOUR business the best.
Finding your DCA is not easy but it is worth the investment. How do you find your DCA? Ask us. We are can help you distinguish your business from all of your competitors.
The 4 Business Quadrants – Your Market
In our previous blog “The 4 Business Quadrants”, the second quadrant is called “Your Market” and is defined by the relatively simple question “Who are your Customers?”.
Defining Your Market
Defining your customers is often easier than deciding how you will identify, attract and interact with them. There are many components to these questions but 2 key elements are
(i) the definition of your market and your marketing strategy and
(ii) the definition of your sales tactics.
The terms sales and marketing are often grouped together, so often that we can hear them as one word, salesandmarketing. They are actually two very different functions. One is tactical; one is strategic. The sales function is tactical, where you identify a prospect, qualify that prospect and close the deal. The marketing function is strategic; it raises awareness and increases the possibility of people wanting to do business with you.
Successful companies have learned that it is logical and productive to put the strategic before the tactical, in other words, have your strategy in place before implementing the tactics to achieve that strategy. Large companies spend millions of dollars on marketing strategies to evaluate their market BEFORE they try to sell their product.
In contrast, most midmarket companies have a tiny marketing division tucked at the bottom of the sales team. These companies have put the tactical before the strategic and often pay a handsome price for this mistake.
Once you have defined your marketing strategy and sales tactics, challenge yourself – are they complimentary? In tough times, sales teams often resort to the predictable conclusion “If I don’t drop my price I will lose the sale”. This behavior may not be consistent with your market reputation or your marketing strategy.
Sales people who don’t have a clear understanding of the marketing strategy or are not able to differentiate their offering from the competitors predictably find it easier to drop the price than to work hard at the real skills of selling. As will be identified in future blogs dropping prices can often be the quickest way to destroy value in your business.
Make sure you come back to read about the other areas of the 4 Business Quadrants – Your Foundation, Your Operations and Your People.
Want to now more? Then subscribe!
The 4 Business Quadrants – Your Foundation
In our introduction to The 4 Business Quadrants, you will see that the first quadrant is “Your Foundation”. The foundation of your business is your business’s reason for being.
Also, when we discussed Business Differences and Similarities , we noted that one of the things linking businesses around the world is that they all have a business foundation. Why does your business exist?
This sounds an easy question to answer until we establish the rule that you cannot answer it numerically. You do not exist to make profit, cash flow or money. These are the results of you doing what you do well.
Your business’s reason for being (or business foundation) is a deeper issue providing you with a compass to determine all other business strategies. If it is not well defined in your business, then all other strategies will be compromised.
How do you assess your business foundation?
One of the easiest ways to assess your business foundation is to ask a number of your staff members, “Why do we exist?” Once they have answered in a predictably numerical fashion, ask the question again explaining that you are seeking a non-numerical reason. If the next set of answers all follow a common theme, you have a strong foundation. However, if, as in most cases we have experienced, there is a huge variety, then your foundation is weak. Presented with this situation, I am sometimes tempted to ask if all the attendees who answered the questions work for the same business!
You may be surprised how powerful this simple exercise is. It can generate passionate and valuable conversations amongst your key employees as well as give you a clear understanding of their views of your business.
Once you’ve established your foundation, you need to communicate it clearly to your team. Everyone needs to know your foundation to be able to move forward together. The foundation needs to be the basis of your business culture. Make it an integral part of all your business disciplines: interaction with your market, interaction with your people (internal and external) and a guide for your procedures and operations.
To be able to steer your business in the right direction, you need to have an accurate compass and that compass is your foundation.
Is your business foundation able to support your future vision for for the business? Come back next time to hear about how your foundation plays into the interaction with your market.
Make sure you come back to read about the other areas of the 4 Business Quadrants – Your Market, Your Operations and Your People.
To find out more about how we can help your business, check out some of the tools available through RealTimeCEO.
The 4 Business Quadrants
How is your Business Balance?
In our blog The Perfect Skill Mix of a CEO, we discussed the ideal attributes for business leaders. In this blog, we will look at the ideal skill mix for your whole business by looking at the 4 Business Quadrants.
There are four business disciplines as detailed in the following graphic:
- Key Functions – Busines Quadrants

Your Foundation:
This is the reason your business exists. It provides motivation to combine your people and processes to create your products and services ready for delivery to your market.
Your Market:
This refers to your strategies to interact with your market, clients and customers that buy your product or service.
Your Operations:
The engine of your business, which includes the equipment, systems, procedures and supplies that enables your business to produce its product or service.
Your People:
The people who work in your business and help to create and deliver your product or service.
We will provide more information about each of these quadrants in future blogs.
Business Balance:
In Fortune 500 companies, these quadrants are equally important and have huge resourcing levels. This is the ideal scenario because all four quadrants are vitally important. Sadly, this is not usually the case in midmarket companies, where the balance is heavily weighted towards operations and to a lesser extent, people. While you may be focused on sales, often your wider “market” strategies are thin. Unfortunately, little focus is applied to your business foundation.

Business Balance – Ideal vs Typical
Does your business need to invest more time and energy into your foundation and your market? Probably.
If your business has weaknesses in any of these areas, it puts you at risk of business failure. These areas even have their own methods of decline. Your business can collapse if your foundation isn’t strong enough. Your business can starve if your market strategies are ineffective. Your business can choke if your engine is not able to accelerate at the required rate. And if you have the wrong people, who are sucking the energy out of your business, it can suffocate.
But on a happier note, you now have the opportunity to avoid that by ensuring your business is solid all the way through. Come back and visit us again and we will elaborate more on each of the business quadrants and show you how to keep your business strong and healthy.
Want to know more? Check out all our simple tools for improving your business.
Business Differences & Similarities
In our last blog, The Perfect Skill Mix of a CEO, we talked about differences among business leaders and the ideal mix of skills. As people are different, so too are businesses. At RealTime CEO we’ve assisted businesses all around the world. These businesses differ in:
- Industry – the type of industry in which the business is involved e.g. manufacturing, engineering, financial, hospitality, consultancy etc.
- Resources usage – some businesses are reliant on machinery; others rely more on people; others rely on technology.
- Commercial versus charity motivation – some businesses have a commercial, profit motivation; others have a charitable or not-for-profit motivation. (Note: Don’t get them mixed up and become a commercial, not-for-profit business. It’s not a good combination!)
- Capacity and constraints – some businesses have greater resources and can buy the best machinery or attract the best people.
But there are other things that all businesses have in common. They all:
- Use INPUT to create OUTPUT – businesses add value (either through production or people) to resources to create a product or service.
- Have foundation principles – your business foundation is the reason your business exists, why you do what you do (more about this in our next blog, Business Foundation).
- Utilise people – where would any business be without its people?
- Have operational functionality – including procedures that govern how to do something and standards against which the business is measured.
- Are seeking access to a market – obviously there needs to be a market for your particular product or service. Some business leaders are also able to influence their markets. RealTime CEO can help you do this.
At RealTime CEO we accept that businesses are different and we can accommodate the needs of your business. We also know the people in your business have different skills and backgrounds and don’t always understand the financial impact of their decisions.
If you’d like some information on teaching your people to speak the same “financial language”, check out our Fiscal Focus blog.
Want to know more? Subscribe Today!
What is the Perfect Skill Mix of a RealTime CEO?
Previously we have discussed J Curve Management and 24 Month Rolling but what makes a great RealTime CEO?
We encounter lots of exciting opportunities in our executive journey, which we can harness to great value in our business. But for all the opportunities we seize, we also face hurdles, challenges and frustrations, things that could hold us up – if we let them hold us up. How you choose to deal with those frustrations will define how successful you are as a CEO. Frustrations cause many people to lose sight of their goals, become negative and complain that it’s not fair. But if you’re one of those rare people who can look at almost any storm cloud and turn it into a positive, then you’re going to win in any scenario.
Being a successful CEO requires the ability to lift your eyes and look out over the horizon, as frequently as possible. This will enable you to define the journey and then plan the strategy and vision for your business. There will be a hundred good reasons why you can’t do this, the eighty things you have to do today and the twenty things you still haven’t done from yesterday. But if you don’t do this, you won’t succeed. Once you have your vision (and it will change every day because your landscape changes every day), you need to be able to share that vision with your people. You need to be good at what you do and you need to have a strong understanding of numbers and finance. The following graphic depicts the perfect skill mix of a RealTime CEO.

In most mid market companies, the CEO’s skills are not quite so balanced.

CEOs of midmarket companies are usually leaders because they’re good at what they do e.g. good architects, good builders, good technicians or sales people. The business builds up around them and one day, the founder becomes the CEO. So while the CEO is operationally very skilled, he or she is unlikely to have had any formal training in running a business. Businesses don’t usually fail because the CEO is not skilled at the original job, more often because there is a lack of understanding of the other key components: Strategy and Vision, Leadership and Motivation and Understanding of Finance.
Come back and visit RealTimeCEO again to see how you can learn from the past to influence the future.
Want to find out more? It is easy – just Subscribe!
J Curves – The Risks
In our last posting on J Curves, we discussed ownership of J Curve investments and the problems involved if ownership is not managed effectively. Now I am sure you all realize that there are other risks associated with J Curves, so what are they?
No J Curves
Whenever I come across a company with no J Curve investments, I know I’m seeing a company that isn’t going to stay in business for the long haul. How can you adapt to the constant changes in the market (opportunities and threats) without J Curves?
Failed J Curves
When a company has a J Curve that fails, the financial losses and/or negative publicity can damage the business, sometimes fatally.
Too many J Curves
Even forward-thinking companies, seeking to innovate and stay ahead of the market, can have difficulties with too many J Curve investments. Having too many J Curves at once can sink a booming company.
When Rolls Royce, a company known for engineering and quality, declared bankruptcy in 1971, most of the blame was attributed to the technical problems of the RB-211 jet engine. Using lightweight carbon fibers in the fan blades to reduce engine weight caused the blades to shatter when hail or birds were sucked into the seven-foot fans. Deadlines were missed and production costs skyrocketed – common occurrences with J Curve investments. Despite the issues with this one engine (which, in the next ten years became one of the world’s most popular jet engines), the biggest problem was the company having too many costly developments running simultaneously. At the time of Rolls Royce’s bankruptcy, almost forty percent of its employees were working in engines that were not yet profitable.
Too many J Curves was a major factor in the company’s bankruptcy.
J Curves are vitally important to a company, however too many, too few or failed J curves can be fatal.
By properly managing your J curve investments, you can eliminate much of this risk.
Come back for my next post, when I’ll start to share my rules for managing J Curves. In the mean time, you can find out more by contacting us. It is easy.
24 Month Rolling – Resistance to 24 Month Rolling
In my last blog on 24 Month Rolling I introduced you to the concepts of Trailing 12 Month Measurement (TTM) and 24 Month Rolling Forecasts. Today we will be looking at areas of resistance to 24 Month Rolling.
I’ve implemented my 24 Month Rolling system on numerous occasions to businesses all around the world. Each time I’ve met with resistance from someone in the company.
24 Month Rolling forecasting is a different approach to predicting and influencing the future. Our 24 Month Rolling software provides you with trailing twelve months (TTM) figures plus projections for the next twelve months, in the one statement. This gives you the best possible picture of your business performance, incorporating past, present and future. It’s not just a forecast mechanism; if adopted properly, this process can have a profound impact on your management culture and effectiveness. But because it’s so different, people are going to resist it because they don’t like change.
Some of the more common areas of resistance are:
1. We don’t have a crystal ball to determine the future. What if our forecast is wrong?
I can deal with this quickly and take the pressure off them by saying that all forecasts are going to be wrong. Nobody has a crystal ball; nobody has a perfect view of the future. This process has never been about the forecast being right or wrong. It’s about the forecast being as accurate as it can be, given all of the information you have at your disposal. And then assessing what our risk profile is if reality is different from the forecast.
2. The idea that we’re moving the goalposts. If each month, we go in and change the numbers on our forecast, how will we ever know where we are?
There’s significant difference between forecasting your perception of the road ahead for the business and changing the targets that you want to achieve. 24 Month Rolling doesn’t change the targets, it simply tracks, as more information comes to light, whether or not you are above or below a target on a 12 month rolling basis.
3. Budgets take time to prepare and then they need to be signed off by the Board. The preparation and approval process takes more than a month so to try to do this each month would be impossible.
Let me address that very clearly. 24 Month Rolling does not replace the necessity, if the necessity exists, to report to external parties on an annual basis, whether that party is a board, a bank or any other external party. 24 Month Rolling is the internal management mechanism, which not only predicts but also influences the future ahead of the business. The real value here is that everything you’re doing in your once a year set period can be done using a rolling 12-month period. Once a year a rolling 12-month period will be identical to a fixed annual period. So everything you’re doing in your fixed annual period, you can do with 24 Month Rolling. The only difference is that 24 Month Rolling will be useful twelve times a year. The fixed annual period will only be useful once a year. But there’s no reason why you can’t take a copy of the forecast from 24 Month Rolling, lock it down for twelve months and send it to the Board for signoff. That can happen as an adjunct to the 24 Month Rolling process.
4. Some transactions are only processed once a year e.g. depreciation.
As long as those transactions are processed in the same month each year then every 24 Month Rolling period will have one of those months. For example, if depreciation is processed in June (as it typically is in Australia) or December (as it typically is in the US) each year, then every rolling 12-month period has one June or one December. So you will always have those once a year transactions included.
5. This takes too much time and will cause more work than we’re currently doing.
The reality is that once the process is set up, 24 Month Rolling will be less work, not more. In fact, it will share the workload of predicting and influencing the future across all executives, not just the finance team.
6. People don’t like the word budgeting.
Quite right. Everywhere I go, people hate the word budgeting so we don’t use that word, we talk about forecasting or planning.
7. My accounting system will not handle this process.
Any limitations the accounting system may create are irrelevant because it’s not within the accounting system that we’re going to manage this process. In our next blog we’ll be talking about the some of the common pitfalls of 24 Month Rolling however, one of the more common pitfalls is to set up your forecast the same as your accounting system chart of accounts. If you do this your forecasting process will not be as effective as it should be.
8. I already have a crowded management agenda, how am I going to fit an extra item into it?
We state and now have strong evidence from my experiences around the world, that the conversations coming out of 24 Month Rolling are some of the most valuable monthly conversations that executive teams can have. Our response is that one of the agenda items currently in your meeting is probably wasting time. Remove that item and put this one right at the top.
My final comment is not so much an area of resistance but an anecdote. At one of my presentations in the UK I was confronted by a somewhat angry Englishman who said (you’ll have to imagine the upper-class English accent), ‘This is blindingly obvious. Why haven’t my financial resources told me about this before?’ He was quite angry that he hadn’t been told something so powerful and something so obvious. I’m very glad that in the end he didn’t shoot the messenger but was able to benefit from our process when he saw how much it could do for his business.
Come back and join us next time when we’ll discuss the common pitfalls associated with implementing 24 Month Rolling. Also, feel free to contact us to find out how we could help in your business.
J Curve Investment Ownership
In our previous blog, we looked at “What are J-Curve Investments?”. Today we would like you to think about your own J Curve investments and consider the following:
- Are you able to name the person in charge of each one?
- Is a single person responsible for managing and tracking their progress, and for measuring results and ensuring they don’t drastically damage the company?
- Do you have one person who is responsible for overseeing ALL of the J Curve investments?
In many mid-market companies (companies between $1 MM and $100 MM in revenue), rarely does a single person own this responsibility. Sometimes the responsibility is shared by a group of executives. This can work because mid-market CEOs and their leadership teams intuitively understand when they’re taking on J Curves.
But most mid-market companies don’t have a formal process for evaluating and managing strategic investments. Nor do they usually measure and track either the performance of the J Curve as an independent entity, or its impact on the business as a whole.
Should they? Absolutely!
Mid-market CEOs need to understand firstly, how many J Curves the company has, and secondly, the current status of each one. As well as the impact the investments have on cash flow, return and profit. They also need to appreciate the hidden cost of J Curves which is the amount of “executive head-space” that is absorbed. This cost is of course the opportunity cost of the other valuable tasks the executive could be completing.
Tune in next time when we’ll look at the risks involved in J Curve investments.
Want to know more? Just contact us!
Core Management Principle 2 – Fiscal Focus
Do you and your executives truly understand all the numerical information provided by your accountant? In my experience, most don’t. But with Fiscal Focus, you can!
Having a background in accounting, I’m lucky enough to understand double entry bookkeeping. Traditional accounting methods such as this are handy for reporting business data to agencies like the tax authorities. But the way the information is presented to reporting agencies is not always the most useful format for business leaders.
One of the issues I see everywhere is that business people who rely on financial data for decision–making have no prior exposure to these kinds of reports. Or if they have, they don’t understand them. Accountants provide reports such as Profit and Loss Statements (P&L) and Balance Sheets. The P&L doesn’t require a lot of training to understand it. That said, most managers tend to rely on the two numbers at the top and bottom of the report being revenue and profit. The Balance Sheet, containing asset, liability and equity figures, is harder to decipher for managers who aren’t trained in accounting.
After moving into management, I realised that executives were highly capable of their particular tasks but often didn’t understand the wider ramifications of their actions. This resulted in people acting as silos with all the problems that entails. By introducing a plain English measurement, which could be understood by managers without a financial background, I was able to demonstrate the impact of my team’s actions on the entire performance of the business.
This morphed into Fiscal Focus – a plain English set of numbers that will help any business, of any size, anywhere in the world, in any industry, to understand their true performance as well as actions impacting the business’s performance.
The diagram below depicts the Fiscal Focus Pyramid. At the top are two main indicators of the health of the business. These indicators are born from two fundamental questions that all entrepreneurs should ask:
- Is the return on investment commensurate with risk?
- Have we generated enough cash flow to continue being an entrepreneur?
Underneath are four mathematical equations that enable us to determine the strengths and weaknesses of any size or kind of business.
On the next level we have eight fiscal focus levers – things that executives can change to influence the performance of the business.

Fiscal Focus Pyramid
Not only does fiscal focus provide a clear insight into the strengths and weaknesses of a business, it also uses a mathematical process called sensitivity analysis. This enables you to determine which one percent change to any of those levers will have the most profound impact on the business’s strengths and weaknesses. Moreover, it will clearly show what is most effective at creating value and improving the cash flow performance of the business.
How much easier would it be to make business decisions if you knew how effective the changes would be before you made the decision?
Our next blog on Fiscal Focus will discuss how this thinking can be used to validate decisions using the simple yet powerful “Should We? Can We?” decision validation technique. You can view our Scenario Builder here!
Want to know more? Then contact us – its easy
24 Month Rolling Forecasts
Do your company’s reporting methods guide you into the future or force you to look backwards? 24 Month Rolling Forecasts provide a powerful management technique that helps you predict and influence the future.
For over a decade I’ve had the privilege of working with businesses in the US, Australia, Canada, the UK and New Zealand, across a wide range of industries. Many of them have been very successful companies, led by shrewd CEOs.
However, when analyzing their financial statements and methods of budgeting, I am constantly surprised that so many companies continue to rely on Year-to-date measurement and annual budgeting.
While Year-To-Date (YTD) is the most common method of financial measurement, it is also the least effective. Likewise, even though annual budgeting is the most common format it is fundamentally flawed.
Today I’m going to introduce the concept of Trailing 12 Month Measurement (TTM) and 24 Month Rolling Forecasts.
Limitations of Year-to-date (YTD) measurement and traditional budgeting
YTD only measures performance over a full year once every year (at the end of the fiscal year). For the other 11 months it is measuring an incomplete year thereby exposing the user to seasonal variation.
Traditional budgeting is also flawed for many reasons:
- Only done once per year
- Focuses only on the income statement,
- Often driven by the CFO who is not necessarily the best qualified person in the business to predict and influence the future.
- Each month hours are wasted comparing variances between actual and budget. These variances may be simply that changes that have arisen during the year that weren’t visible when the budget was made. Even the best CEOs probably don’t have real psychic ability!
Consider this analogy:
Companies that budget their future for the next twelve months, without updating it each month, are like a car driver who stares at a spot 120 metres in front of them and continues to stare at the same spot until they reach it. Safe drivers know to keep their field of vision consistently forward.
Are you staring at a spot on the road and putting your business at risk? Or do you believe that business conditions are constantly changing and each month we learn new and valuable information about the road ahead?
Why is Trailing Twelve Month (TTM) and 24 Month Rolling more effective?
TTM is underpinned by the internal recognition that each month is the conclusion of a 12 month period. No month end is any more important than any other. By viewing the business this way, we remove the impact of seasonality. This is important because seasonality can create a veil that disguises trend changes.
24 Month Rolling forecasts have numerous advantages over traditional budgeting, not least is the ability to accommodate a rapidly changing landscape. If a business could confidently say their landscape only changed once a year, traditional budgeting would be fine, however, I have never met a business that could say that!
24 Month Rolling forecast provides you with trailing twelve months (TTM) figures plus projections for the next twelve months, in the one model. This gives you the best possible picture of your business performance, incorporating past, present and future.
Imagine if you could get inside a time machine to go forward in time 12 months… You could see where your company is at that point of time and look back to the “current date” with all the benefits of hindsight. And if you weren’t happy with your hindsight view of the current date, you could jump back in the time machine and return to the current data and do something about it in RealTime. 24 Month Rolling Forecasts provide that time machine!
RealTime CEOs learn from the past so they can influence the future by acting now, in RealTime.
In the next 24 Month Rolling post, I will expand on how to overcome predictable yet meaningless resistance to 24 Month Rolling forecasts.
If you would like to find out more, you can always contact us. We’d love to hear from you.
What are J Curve Investments?
The old adage tells us that you have to spend money to make money.
J Curve investments are strategic decisions to spend money today to receive a benefit tomorrow. J Curve investments result from decisions to incur a short-term financial loss, which will be recovered in the future. The long-term benefits should outweigh the cost of the initial investment.
As I have indicated on the J Curve Management introductory page, every business has J Curves; some examples include:
- Adding a new product line
- Accessing a new market
- Hiring new staff
- Purchasing new equipment
- Opening a new location
- Moving manufacturing overseas
- Investing in R&D
- Acquiring competitors
J Curve investments can be classed as ‘macro’ – having an impact on the entire business, or ‘micro’ – having an impact on part of the business.
How important is it to properly undertake and manage J Curves? As I see it, the key to entrepreneurial success lies in identifying, prioritizing and managing J Curves.
In my next post on J-Curves, I will discuss the importance ‘Ownership of J-Curve Investments’
If you would like to find out more, you can always contact us. We’d love to hear from you.
Should We? / Can We? Scenario Builder
After many requests for a demonstration of the ‘Should We? / Can We? Scenario Builder’, we have now published a screencast for you to view.

To learn more about this powerful tool, start the Subscription process …. (don’t worry – it’s free to start!)
The new RealTime CEO website

Welcome to the new RealTime CEO website!
After 10 years of delivering Vistage and TEC workshops and providing tools and services under the Fiscal Focus brand, we decided to rebrand to better communicate the essence of what we represent to our market.
Our offering isn’t just a set of numbers for financially-minded CEOs of mid-market companies; it’s a set of software tools and support to allow you see what’s happening in your business right now, in real time, and in the future.
Though our brand is new, our software, support and tools have been validated in over 1,000 companies worldwide. They work for any company, in any industry, of any size, anywhere in the world.
If you like what you’re seeing, keep in touch. We’d love to hear from you.
The New RealTime CEO Website
Welcome to the new RealTime CEO website!
After 10 years of delivering Vistage and TEC workshops and providing tools and services under the Fiscal Focus brand, we decided to rebrand to better communicate the essence of what we represent to our market.
Our offering isn’t just a set of numbers for financially-minded CEOs of mid-market companies; it’s a set of software tools and support to allow you see what’s happening in your business right now, in real time, and in the future.
Though our brand is new, our software, support and tools have been validated in over 1,000 companies worldwide. They work for any company, in any industry, of any size, anywhere in the world.
If you like what you’re seeing, keep in touch. We’d love to hear from you.
Stay Connected
Find out how much value you're creating by subscribing now.

Recent Posts
- ‘COVID-Zero’: Can We Afford It?
- Economics After COVID: Boom, Bust, or Something In-Between?
- Voodoo Finance For Sick Markets: Stock Prices During COVID-19
- Modern Monetary Theory
- Financial Forecasting – Introducing a Powerful New Module of the RealTime CEO Software
Categories
- Fiscal Focus (2)
Get Blog Updates via Email:

Company
Contact Us
© 2024. RealTime CEO. All Rights Reserved